
Logging on vs logging off: the configuration gap in LiteLLM's benchmark
LiteLLM's benchmark blog says no gateway logged or persisted anything. The Bifrost v1.6.4 config it published never sets enable_logging or a log store, and the defaults then switch on logging, a SQLite store and built-in plugins. That is inferred from v2.4.0 code, not confirmed on v1.6.4.
Logging performance is rarely the headline of a gateway benchmark, but it decides what the benchmark measures. LiteLLM’s Rust gateway benchmark says every gateway ran “with no logging callbacks, spend tracking, or persistence enabled”. The configuration LiteLLM published for Bifrost v1.6.4 leaves the two logging settings unset, and the gateway’s defaults then switch logging, a SQLite log store and several built-in plugins on. That conclusion is inferred from v2.4.0 code and not confirmed on v1.6.4.
TL;DR
- LiteLLM’s benchmark blog states that every gateway ran with no logging callbacks, spend tracking or persistence, and calls the setup “not a full-feature comparison”.
- The Bifrost config in LiteLLM’s repo sets a simulated upstream and
config_store: enabled: false, lists no plugins, and never setsenable_loggingorlogs_store.- Those gaps resolve to defaults:
enable_loggingtrue, a default SQLite log store, the built-in logging plugin loaded, and telemetry, governance, routing and compat active. This is inferred from v2.4.0 code and not confirmed on v1.6.4.- Logging performance costs land in the results: log buffering and SQLite writes show up in whole-process CPU and memory, though the files do not quantify their share of any gap.
- A follow-up rerun is planned that runs both gateways with logging off and again with logging on, on a current build, with repeated trials and error bars.
What LiteLLM says its benchmark switched off
LiteLLM’s benchmark blog says every gateway was measured “with no logging callbacks, spend tracking, or persistence enabled”. The blog presents this as a forwarding-overhead test and states plainly that “it is not a full-feature comparison”. The question here is whether the published Bifrost configuration matches that description.
The claim appears in LiteLLM’s benchmark methodology post, which backs the multipliers on its homepage benchmark section: roughly 7x lower overhead, 9x less memory and about 4.5x more requests per dollar than the next-closest gateway. The blog lists the systems tested as the LiteLLM Rust beta, LiteLLM Python v1, Bifrost v1.6.4 and a fourth open-source gateway, all run with the “same mock and load driver on one host”.
A statement that every system ran with logging off is a configuration claim, and configuration claims can be checked. LiteLLM published its gateway configs and raw results in the ai-gateway-bench repository, which is what makes the check possible at all. Set the “no logging” sentence against the Bifrost config file and against Bifrost’s code, and the result is short: logging and plugins were enabled for Bifrost and, by LiteLLM’s account, disabled for LiteLLM. That is an inference from v2.4.0 code, not yet confirmed on v1.6.4.
Two boundaries apply from the start. The LiteLLM Rust config has not been read the same way, so LiteLLM’s description of its own gateway is taken as given here. And the reading of Bifrost’s defaults comes from Bifrost’s source and documentation, which anyone can check but which no third party has yet confirmed against a v1.6.4 run. Both points limit how far the finding can be pushed. The Frontier Wire’s hub report on the LiteLLM Rust benchmark covers the other headline claims; this piece stays on the configuration.
The Bifrost config LiteLLM published
The Bifrost configuration in LiteLLM’s benchmark repository is short: one provider pointed at a local simulated upstream, and a config store switched off. It contains no plugin list, no logs_store block and no enable_logging setting. Everything the file leaves out falls back to the gateway’s defaults.
The file is gateways/bifrost/config.yaml, as of November 1, 2026. It defines a provider whose network configuration targets a mock server on the local machine, marks chat completion and streaming as allowed request types, and ends with config_store: enabled: false. The repo’s Bifrost README says the benchmark used v1.6.4 through its npx launcher, with the YAML converted to config.json in an application directory.
That shape matters because of how configuration usually works in gateways. A config file rarely spells out every setting. Anything absent takes the default the software ships with, and defaults are chosen for a typical deployment, not for a benchmark. A production gateway is normally expected to record requests, so request logging defaulting to on is a reasonable product choice. In a benchmark that claims logging was off, it is the setting that most needs to be stated explicitly.
Nothing in the file suggests the omission was intentional. The more ordinary reading is that “no plugins” and “config store off” were taken to mean “nothing extra running”. In this gateway’s code, as read in v2.4.0, those two settings do not mean that.
How unset settings resolve to logging on
An unset enable_logging defaults to true, a missing logs_store creates a default SQLite log store, and the built-in logging plugin then loads regardless of the empty plugin list. Request and response bodies are logged too, because disable_content_logging defaults to false. All of this is inferred from v2.4.0 code and not confirmed on v1.6.4.
The table sets each setting in the published config against the default behavior read in v2.4.0 code. The equivalent v1.6.4 files are public, in lib/config.go and server/plugins.go, for anyone who wants to check the inference against the tested version.
| Setting | What the published config does | Default behavior, read in v2.4.0 code |
|---|---|---|
enable_logging | Not set | Defaults to true when unset |
logs_store | Not set | Creates a default SQLite log store; the stored-config lookup is skipped when the config store is nil, as in this setup |
| Logging plugin | No plugins listed | Loads when enable_logging is unset or true and a log store exists; it is built in, so “no plugins” does not turn it off |
| Other built-in plugins | No plugins listed | Telemetry on unless disabled; governance on in the open-source build; routing loads with governance; compat always registered |
config_store.enabled: false | Set | Only leaves the config store nil; does not turn off the log store or the plugins |
disable_content_logging | Not set | Defaults to false, so request and response bodies are logged |
Figure 1 traces the same chain. The point it makes is that nothing in the file switched logging on. The absence of two settings did.
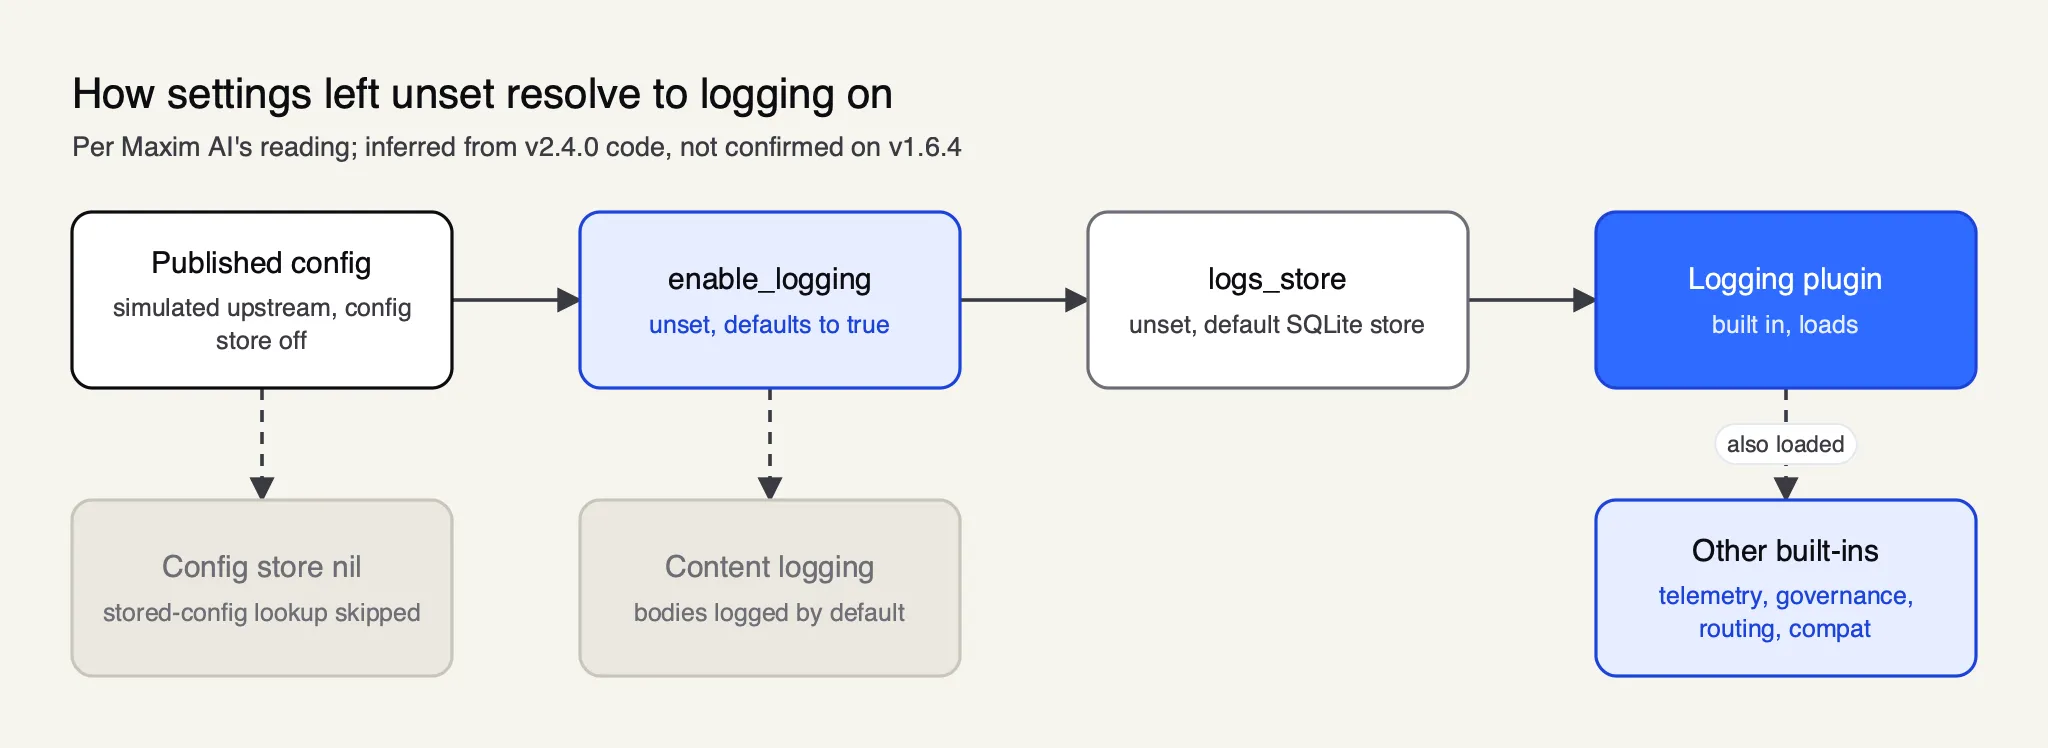 Figure 1: Nothing in the benchmark config switched logging on; the defaults did, as read in v2.4.0 code.
The gateway’s current public documentation is consistent with that reading for current builds. Its observability page states that the logging plugin is automatically enabled in gateway mode with SQLite storage by default, describes enable_logging as the master toggle for request tracing, and describes disable_content_logging as dropping request and response content while still logging usage metadata. Current documentation describes current builds; it does not by itself establish v1.6.4’s behavior, which is why the hedge stays.
The config_store row is the one most likely to mislead someone writing a benchmark config. The gateway setup guide explains that config_store.enabled: false selects file-only mode, where config.json is the only configuration source and no configuration database is used. That is a statement about where configuration lives, not about whether requests are logged. Logs go to a separate store. Switching off the first does not switch off the second.
The built-in plugins that stay loaded
Turning logging off would not, by itself, produce a forwarding-only gateway. Telemetry stays on unless disabled, governance is on in the open-source build, routing loads with governance and compat is always registered. A controlled comparison has to account for those hooks as well as for the log writer.
The breakdown of the other built-in plugins in LiteLLM’s setup, as read in v2.4.0 code, is specific about what loads and what does not:
- Telemetry is on unless disabled.
- Governance is on in the open-source build.
- Routing loads with governance.
- Compat is always registered.
- The model catalog resolver loads when a model catalog is configured.
- Prompts needs a config store, so it is off in this setup.
- OTel, semantic cache and other optional integrations load only when configured, so they are off here.
The reason this list matters is that a plugin is code that runs on the request path. Each loaded plugin can register hooks that run before or after a request is forwarded. A benchmark that wants to measure “gateway overhead” in the narrow sense LiteLLM’s blog describes needs every system reduced to the same minimal path, or else a published statement of what each system was doing per request.
Measuring what those plugins and the logger contributed needs a controlled rerun, because disabling logging alone does not remove the other plugins’ hooks. The finding, then, is not that flipping one flag would make the comparison like-for-like. It is that the published configuration did not match the blog’s description, and that measuring the difference needs a designed experiment. For the broader picture of what a gateway layer does per request, The Frontier Wire’s explainer on running an AI gateway in front of every model call covers the stages in general terms, and a vendor primer on what an AI gateway is describes the same layer from the builder’s side.
The v2.4.0 caveat, stated precisely
The logging finding is an inference from v2.4.0 code, not yet confirmed on v1.6.4. The defaults were read in a newer build than the one LiteLLM tested. Until someone confirms the behavior on v1.6.4, or reruns the benchmark with logging set explicitly, the finding is a well-grounded inference, not a measured fact.
The distinction is worth spelling out, because it is the most likely point of dispute. LiteLLM tested v1.6.4. Bifrost’s changelogs list v1.6.5 to v1.6.11 and then v2.0.0 to v2.4.0 after it. Defaults can change between releases. A default that is true in v2.4.0 might, in principle, have been different in v1.6.4, and line numbers in a newer file say nothing directly about an older one.
Some evidence does concern v1.6.4 directly, and it is consistent with a log store being present in the tested build. v1.6.4 opens a disk-backed logs.db and runs migrations at startup, configuring _cache_size=10000, and its log writer thresholds are set in the v1.6.4 log store config. Those details point the same way as the inference. The verdict on the logging state in the benchmark run still stays labelled as unconfirmed.
There is a second, separate caveat. Only the Bifrost side has been checked. The LiteLLM Rust config has not, so the “logging off” description of LiteLLM’s own gateway rests on LiteLLM’s blog. A fully symmetric audit would read both configs. That is part of why the planned rerun runs both gateways in both modes rather than relying on anyone’s reading of anyone’s defaults.
| Statement | Status |
|---|---|
| LiteLLM’s blog says no logging callbacks, spend tracking or persistence for every gateway | Quoted from the blog |
The published Bifrost config sets no enable_logging and no logs_store | Read from the config file |
| Those defaults resolve to logging on with a SQLite store and the logging plugin loaded | Inferred from v2.4.0 code, not yet confirmed on v1.6.4 |
v1.6.4 opens a disk-backed logs.db at startup with _cache_size=10000 | Stated for v1.6.4, visible in the v1.6.4 source |
| LiteLLM Rust ran with logging off | LiteLLM’s description; the LiteLLM Rust config has not been checked |
| How much logging contributed to any measured gap | Not quantified; needs a controlled rerun |
Why logging performance matters in a benchmark
A gateway with logging on does more work per request than one with logging off: it captures an entry, queues it, batches it and writes it to a database. Whole-process CPU and memory measurements include all of that. Bifrost’s results in this benchmark therefore include log buffering and SQLite writes, and the files do not isolate logging’s share.
For engineers, the useful way to think about this is in terms of what a benchmark can and cannot separate. Figure 2 shows a generic gateway with a buffered log writer. The top row is the request path the benchmark intends to measure. The bottom row is background work that a logging-on run adds.
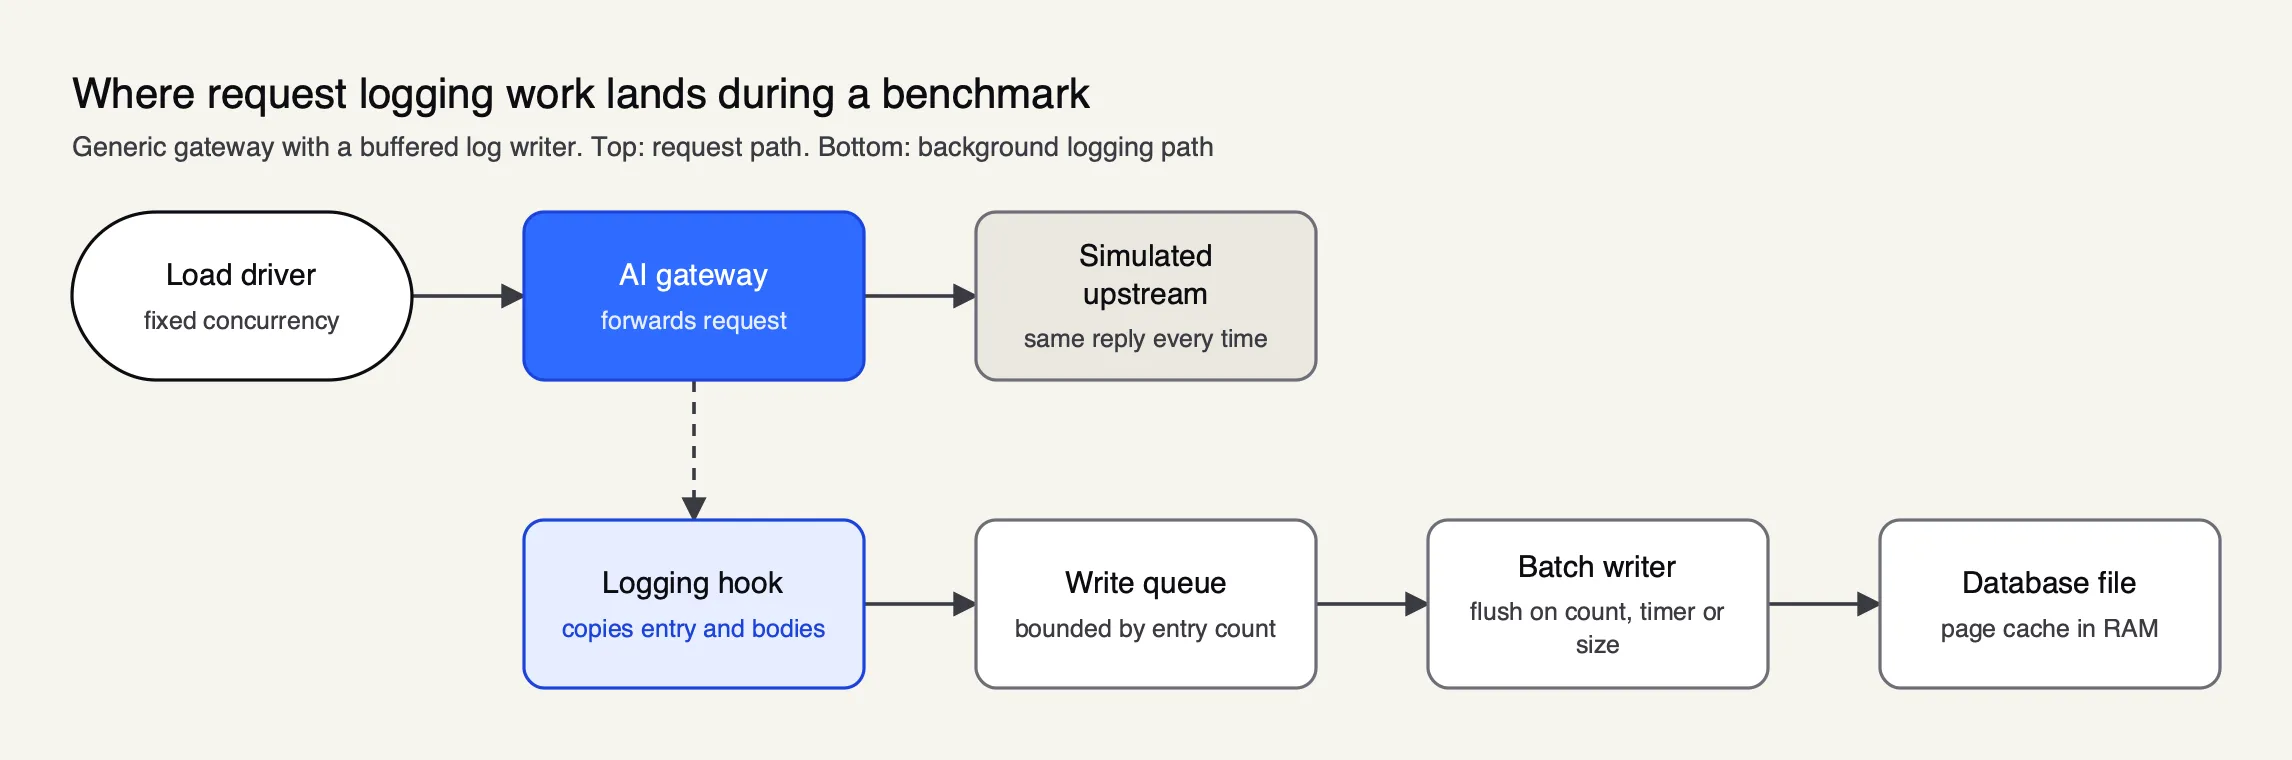 Figure 2: Whole-process CPU and RSS measurements include both rows, so a logging-on run and a logging-off run measure different workloads.
Each stage in the bottom row has a cost that lands somewhere in the results:
- The hook copies request metadata and, with content logging on by default, request and response bodies. That is CPU work and memory allocation per request.
- The queue holds entries until they are written. Entries waiting in memory count toward the process’s resident memory.
- The batch writer flushes entries to the database in groups. That is CPU and disk work that happens alongside request handling.
- The database file has its own page cache in process memory, which grows as it is used.
How visible each cost is depends on what the benchmark measures. LiteLLM’s CPU figures are whole-process, and the files do not separate request handling from background work. Peak resident set size (RSS) is also whole-process, so any memory held by the log queue or by SQLite counts toward it. Latency is the least direct: the logging work runs off the request path in a buffered design, but it competes for the same host’s CPU, and the benchmark ran every gateway on a single host. No published figure shows a specific latency effect, and this article does not claim one.
Concurrency raises the stakes in a simple way. A buffered writer flushes on whichever limit it hits first, and in v1.6.4 those limits are 1,000 entries, 5 seconds from the first entry, or 300 MiB of estimated payload. At higher request rates, entries arrive faster, so the count limit is reached sooner and batches are written more often. The queue in v1.6.4 holds 10,000 entries, bringing queue-plus-batch capacity to approximately 11,000 entries, and new entries are dropped when the queue is full. These are entry-count bounds and an approximate batch threshold, not a total memory cap.
None of this establishes how large the effect was in LiteLLM’s runs. It establishes why a benchmark that says “no logging” needs to show it, and why the right framing for the CPU and memory gaps is that the two configurations performed different work. The Frontier Wire’s guide to LLM observability explains why gateways capture these logs at all; the benchmark question is only whether every system in a comparison was doing the same amount of it.
Memory: what logging can and cannot explain
The memory pair LiteLLM’s blog cites, 199.1 MB for Bifrost against 21.8 MB for Rust, differs by 177.3 MB, and the files do not establish how much, if any, of that gap comes from logging buffers. Bifrost’s RSS is already about 282 MB before the first request in one file, which points primarily to a baseline footprint.
This is the section where the logging argument is easiest to overstate. Rust is smaller on memory in every file of the benchmark repository: its highest figure, about 36 MB, is below Bifrost’s lowest, about 144 MB. The homepage uses the widest of three memory pairs, and its “memory at rest” label is mislabelled: the figure is peak RSS, in a column named peak_rss_mb. The Frontier Wire’s fact-check of LiteLLM’s benchmark claims covers that label in full.
On the logging question specifically, three points hold:
- Baseline, not growth. In
cpu_bifrost.csv, RSS is about 282 MB before the first request, and load adds only about 16 MB. That points primarily to a baseline footprint rather than growth in the log buffer, although RSS alone cannot identify which components account for it. - SQLite contributes independently of the queue. v1.6.4 configures
_cache_size=10000in its SQLite setup, a suggested limit of 10,000 pages per connection, approximately 39.1 MiB at a 4 KiB page size. Under SQLite’s cache semantics, that cache grows on demand; it is neither preallocated in full nor evidence that the whole database is loaded into RAM. SQLite’s caches and connection state can contribute to baseline RSS before benchmark traffic. - Not quantified. The files do not quantify the SQLite contribution or isolate logging’s share of the gap. That requires profiling and a logging-off comparison.
So the accurate summary is narrower than “logging explains the memory gap”. Default-on logging means a SQLite log store and a write queue were present in the measured process, and both can hold memory. How much they held is unknown from the published data. Bifrost 2.x has since reduced memory use by changing what data it retains and how it stores it in memory, but no figure has been published yet, and the v1.6.4 benchmark does not reflect those changes.
Where the gap touches the published results
Every Bifrost figure in LiteLLM’s benchmark was recorded under the configuration described above, so each one includes whatever the default logging and plugins cost. That does not mean any figure would change by a known amount. It means the comparison is between different workloads, and the Rust leads should be read that way.
The table collects the published figures most exposed to the configuration difference, all as of November 1, 2026.
| Measure | LiteLLM Rust | Bifrost v1.6.4 | How the logging question applies |
|---|---|---|---|
| CPU, mean | 0.66% | 2.59% | Whole-process; files do not separate request handling from background work |
| CPU, peak | 15.9% | 79.5% | Bifrost peak falls inside a roughly two-second request burst |
| Peak RSS, blog pair | 21.8 MB | 199.1 MB | Logging’s share of the 177.3 MB gap not established |
| RSS before first request | Not reported here | About 282 MB | Points primarily to baseline footprint |
| Modeled cost per hour | $0.0099 | $0.0434 | Bifrost’s logging cost is inside the model’s inputs |
| Added p99, concurrency 64 | +40.28 ms | +28.68 ms | Recorded with Bifrost’s defaults in place |
The CPU figures come from cpu_rust.csv and cpu_bifrost.csv. They are whole-process measurements under the configurations described above, and the Rust lead is real: approximately 3.9x on the mean and 5x on the peak. Both things hold at once. The Rust beta did use less CPU and memory, and the two systems were not doing the same job.
The cost row is a knock-on effect. The “~4.5x more requests per dollar” figure on LiteLLM’s homepage is modeled from measured CPU, peak RSS and throughput, priced on an assumed 4 vCPU / 16 GB instance, using figures in rps_per_dollar.csv. The arithmetic holds, and Bifrost’s logging cost is inside the inputs. Any extra work in the measured inputs flows straight into the modeled dollars.
Latency and throughput are where the configuration question cuts least clearly. LiteLLM’s concurrency sweep shows the two gateways within a fraction of a millisecond at concurrency 1 to 16 and throughput gaps under 1%; the plainest reading is that LiteLLM Rust caught up to where Bifrost already was. Those numbers were recorded with the defaults in place. No published data shows whether they would improve with logging off, and this article does not speculate. The Frontier Wire’s analysis of the latency sweep covers those rows in detail.
The settings that switch the logging work off
client_config.enable_logging: false removes the built-in logging plugin’s queue and hooks at startup, and client_config.disable_content_logging: true keeps logging but reduces logged payloads. Other plugins remain enabled independently, so neither setting yields a forwarding-only gateway on its own.
For a benchmark author, the practical lesson is to set the features under test explicitly rather than relying on their absence. A minimal addition to a config like LiteLLM’s would state the logging choice outright. In JSON form, the relevant keys look like this:
{
  "client_config": {
    "enable_logging": false,
    "disable_content_logging": true
  }
}
With enable_logging false, the second key is redundant for the logging plugin, but a published config that shows both leaves no room for doubt about intent. The gateway’s observability documentation documents both keys and the logs_store block that selects SQLite or PostgreSQL, and a guide to LLM logging and OTel tracing in Bifrost from the gateway’s developers walks through the same settings from the operator’s side.
There is also a middle path: keeping logging on but shrinking the buffer. Setting logs_store.writer.max_batch_size: 100, batch_interval: "1s" and write_queue_capacity: 1000 lowers queue-plus-batch capacity to approximately 1,100 entries. That is not necessarily 10x lower RSS, and it can increase write overhead and log drops under bursts. The trade-off is the general one for any buffered logger: smaller buffers hold less memory but write more often and drop sooner when traffic spikes.
The same discipline applies to every gateway in a comparison, not just one. LiteLLM’s own proxy has its own logging and callback settings, and the LiteLLM Rust config has not been checked for how it set them. A benchmark that publishes each system’s full effective configuration, defaults included, answers the question before anyone needs to read source code. Teams comparing the two products on features rather than this benchmark will find vendor perspectives in a LiteLLM alternative overview focused on performance and governance, an enterprise comparison of the two gateways and a guide to migrating from LiteLLM, all published by the gateway’s developers.
What a like-for-like rerun needs
A like-for-like rerun holds everything fixed except one variable: each gateway runs with logging off, then again with logging on, on the same host, mock and load driver. A Part 2 rerun has been announced with exactly that design, plus a current Bifrost build, repeated trials with error bars and full disclosure of hardware and settings.
Figure 3 shows the structure. Comparing the two logging-off runs answers the question LiteLLM’s blog set out to answer, which is forwarding overhead with persistence disabled. Comparing each gateway’s off and on runs answers a second question the original benchmark could not: what logging costs each system.
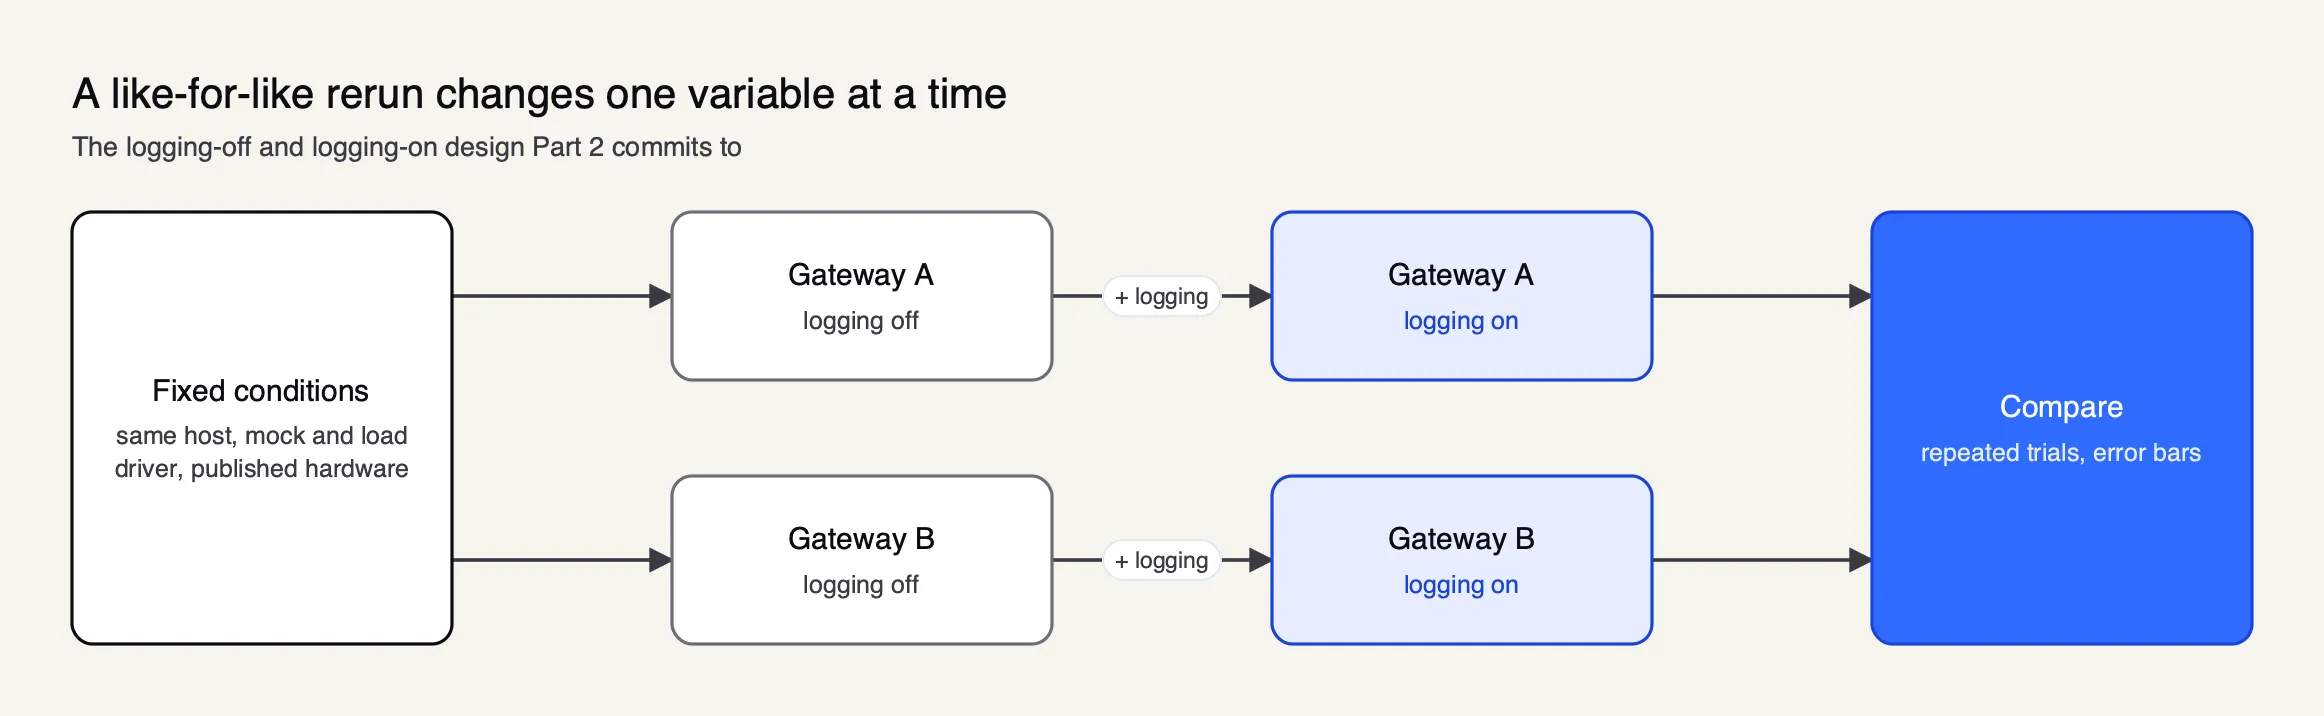 Figure 3: Comparing the two logging-off runs isolates the gateways; comparing off with on isolates what logging costs each one.
The announced Part 2 plan has four parts, each aimed at a gap in the original benchmark:
- Logging off and on. Run both gateways with logging off, and again with logging on.
- A current build. Use a current Bifrost build, repeated trials and error bars.
- Full disclosure. Publish hardware, worker counts, mock latency and concurrency for every run.
- Heap profiles. Take a heap profile to measure how much of the memory gap is the log buffer.
The repeated-trials point connects directly to the configuration question. LiteLLM’s blog describes its results as “single-host, per-scenario runs (for example n=5000 on the overhead panel) without repeated-trial error bars”, and each cell appears to be a single run. If a logging-on run differs from a logging-off run by a small amount, single runs cannot tell that difference apart from run-to-run variation. The Frontier Wire’s piece on benchmark sizes and statistical noise makes the general case for error bars; a 2x2 design without them would repeat the original problem four times over.
A checklist for anyone running their own gateway comparison follows from the same reasoning:
| Check | Why it matters for logging |
|---|---|
| Publish each system’s effective config, defaults included | An unset key can mean “on” |
| Set logging, content logging and persistence explicitly | Absence of a setting is not a statement of intent |
| List every plugin or middleware that loads, built-in or not | “No plugins” may not mean no hooks |
| Run each system with logging off and on | Separates gateway cost from logging cost |
| Repeat trials and publish error bars | Small off/on differences need variance to interpret |
| Report whole-process CPU and RSS alongside a heap profile | Shows which component holds the memory |
What the configuration gap does and does not show
The configuration gap shows that LiteLLM’s benchmark compared different workloads: Bifrost ran with default logging and built-in plugins on, while LiteLLM reports logging off. It does not show how much that changed any number, and the Bifrost side is inferred from v2.4.0 code and not confirmed on v1.6.4.
The claim is limited and well supported. LiteLLM’s blog states a configuration. The published Bifrost config does not set the two keys that would make that statement true, and the gateway’s defaults, as read in v2.4.0 code and as described in current documentation, turn logging on when those keys are absent. The blog’s sentence about “no logging callbacks, spend tracking, or persistence” is therefore not supported as stated for the Bifrost run, pending confirmation on v1.6.4.
What the gap does not do is reverse the benchmark’s direction on resources. The Rust beta used less CPU and less memory in every file. Bifrost’s roughly 282 MB of RSS before the first request points to a baseline footprint that logging alone is unlikely to account for, though no published file quantifies it either way. The cost model inherits whatever the inputs contain. Latency and throughput were already close.
For engineers, the durable lesson is about defaults. A benchmark config is a claim about what each system was doing, and defaults are part of that claim whether or not they appear in the file. Logging performance is a real cost in any gateway, which is exactly why a benchmark that says logging was off needs to show the setting, for every system, in the published config. The announced logging-off and logging-on runs are the test that would turn the inference into a measurement, and The Frontier Wire’s hub coverage of the LiteLLM Rust benchmark will be the place to follow the result.
Source: Debunking LiteLLM Rust Benchmarking: Part 1, by Akshay Deo of Maxim AI, which builds the Bifrost gateway.
Sources
- Debunking LiteLLM Rust Benchmarking: Part 1 (Akshay Deo, Maxim AI, November 1, 2026)
- LiteLLM blog: Rust AI gateway benchmarks (methodology)
- LiteLLM homepage benchmark section (litellm.ai)
- ai-gateway-bench: Bifrost gateway config.yaml
- ai-gateway-bench: Bifrost gateway README
- ai-gateway-bench: results directory
- ai-gateway-bench: cpu_bifrost.csv
- ai-gateway-bench: cpu_rust.csv
- ai-gateway-bench: rps_per_dollar.csv
- ai-gateway-bench: latency_vs_concurrency.csv
- Bifrost v1.6.4 source: transports/bifrost-http/lib/config.go
- Bifrost v1.6.4 source: transports/bifrost-http/server/plugins.go
- Bifrost v1.6.4 source: framework/logstore/sqlite.go
- Bifrost v1.6.4 source: framework/logstore/config.go
- Bifrost docs: built-in observability and logging settings
- Bifrost docs: setting up the gateway (config store modes)
- SQLite documentation: PRAGMA cache_size
Questions readers ask
Were Bifrost and LiteLLM benchmarked with the same settings?
Not as published, as of November 1, 2026. LiteLLM's blog says every gateway ran with no logging callbacks, spend tracking or persistence. The Bifrost v1.6.4 config in LiteLLM's repo never set enable_logging or logs_store, and in Bifrost's code those defaults turn on logging and a SQLite log store. The finding is inferred from v2.4.0 code and not confirmed on v1.6.4.
Does logging affect gateway performance in a benchmark?
It changes the work being measured. A gateway that logs copies each request into a queue, batches entries and writes them to a database, and whole-process CPU and memory figures include that work. Bifrost's results in LiteLLM's benchmark therefore include log buffering and SQLite writes, but the published files do not quantify how much of any gap that explains.
How do you turn off request logging in Bifrost?
Set client_config.enable_logging to false, which removes the built-in logging plugin's queue and hooks at startup. Setting client_config.disable_content_logging to true keeps logging but drops request and response bodies. Neither setting disables the other built-in plugins, such as telemetry and governance.
Is the logging-on finding confirmed for Bifrost v1.6.4?
No. It is inferred from v2.4.0 code and not yet confirmed on v1.6.4, the version LiteLLM tested. The LiteLLM Rust config has not been checked in the same way either. A follow-up rerun that runs both gateways with logging off and again with logging on is planned to settle the question.
What would a like-for-like gateway benchmark look like?
Both gateways run with logging off and again with logging on, on the same host, mock and load driver, using a current build, repeated trials and error bars. Hardware, worker counts, mock latency and concurrency are published for every run, and a heap profile shows how much of any memory gap is the log buffer.