
Fact check: LiteLLM's Rust benchmark claims, tested against its own repo files
LiteLLM's homepage and benchmark blog credit its Rust gateway with about 7x lower overhead, 9x less memory and about 4.5x more requests per dollar. Fifteen claims, set against the CSV and JSON files LiteLLM published, with neutral verdicts, including the ones that check out.
LiteLLM’s homepage says its new Rust gateway adds 0.66 ms of p99 latency, holds about 22 MB of “memory at rest” and delivers about 4.5x more requests per dollar than the next gateway it names. Those LiteLLM benchmark claims can be checked, because LiteLLM published the raw CSV and JSON files behind them in its ai-gateway-bench repository. Set against those files as of November 1, 2026, some claims hold exactly, one is mislabeled, and the headline overhead figure appears in no row of LiteLLM’s own concurrency sweep.
TL;DR
- The 7x overhead claim rests on a 4.54 ms Bifrost figure that no row of LiteLLM’s concurrency sweep reproduces; in that sweep Bifrost adds less p99 latency than Rust at concurrency 1 and 64, and Rust adds less at 16.
- The homepage calls its memory figure “memory at rest” and uses the widest of three memory pairs, but the data is peak RSS. LiteLLM’s blog correctly calls it “peak memory”.
- The 4.5x requests-per-dollar arithmetic holds, but it is a cost model built on an assumed 4 vCPU / 16 GB instance, not a measurement on the benchmark machine.
- LiteLLM’s blog accurately warns that the runs are single-host with no repeated-trial error bars; the homepage tiles do not repeat that caveat.
- Rust genuinely leads on memory in every file, on mean and peak CPU, and in an exploratory concurrency-256 run.
The fact-check table
Fifteen performance claims appear across LiteLLM’s homepage benchmark section and its benchmark blog post. Checked against the files in the repo as of November 1, 2026, three are accurate, three are accurate arithmetic (two of them on modeled inputs, one against a different gateway), and the other nine are not reproducible, mislabeled, incomplete, unsupported or impossible to check from what was published.
This piece links each file it relies on. The Frontier Wire’s overview of the LiteLLM Rust benchmark covers the setup and the three headline claims at summary level. The table is the summary. Each row gets its own section below.
| Claim | Where it appears | What the files show | Verdict |
|---|---|---|---|
| Rust adds 0.66 ms at p99; Bifrost 4.54 ms | Homepage | 4.544 ms appears in overhead_comparison.csv, which states no concurrency. The sweep shows Bifrost at +0.75, +0.63, +0.89 and +28.68 ms | Not reproducible from published data |
| “Roughly 7x lower overhead” than Bifrost (0.7 ms vs 4.5 ms) | Blog | Same 4.5 ms figure; no sweep row is near it, and Bifrost is lower at concurrency 1 and 64 | Not reproducible from published data |
| “3.5x lower overhead than the next AI gateway” | Homepage | 0.66 ms against a different gateway at 2.29 ms (2.29 / 0.66 = 3.5x), not against Bifrost | Accurate arithmetic, different comparison |
| “Memory at rest”, ~22 MB vs ~199 MB | Homepage | 199.1 vs 21.8 MB in a column named peak_rss_mb; the widest of three pairs | Mislabeled |
| “9x less memory”, “21.8MB peak memory against 199.1MB” | Blog | Matches the files and uses the term that matches the column | Accurate (widest pair) |
| Throughput “2,800+ req/s”, Bifrost cell a dash | Homepage | 2,814 vs 2,744 req/s in rps_per_dollar.csv; 2,722 vs 2,719 in the sweep | Incomplete |
| “2,800+ req/s (at ~21% CPU)” | Homepage | cpu_rust.csv peaks at 15.9%; no file read contains ~21% | Unsupported |
| “Single client” | Homepage | The sweep runs concurrency 1 to 64; the throughput point uses ceiling_concurrency = 64 | Not supported as stated |
| “~4.5x more requests per dollar” | Homepage | 283,833 vs 63,246 requests per dollar-hour | Accurate arithmetic, modeled inputs |
| Rust cost “roughly 6x below Bifrost” | Blog | $0.000175 vs $0.001008 per million requests, about 5.8x; a different metric from the page’s 4.5x | Accurate arithmetic, modeled inputs |
| “Identical hardware”, “Run it yourself”, “See the benchmark” | Homepage | No machine type, core count or worker count; the link points to the in-page #benchmark anchor | Cannot be checked from the page |
| “No logging callbacks, spend tracking, or persistence enabled” | Blog | The Bifrost config leaves logging at its default, which is on (inferred from v2.4.0 code, not confirmed on v1.6.4) | Not supported for the Bifrost run |
| “Single-host… without repeated-trial error bars”, “order-of-magnitude differences” | Blog | Matches the files; the ranking flips between two of them at concurrency 64 | Accurate |
| Versions: “Bifrost v1.6.4”, “LiteLLM Rust beta” | Blog (homepage shows none) | v1.6.4 confirmed in the gateway README; later releases run to v2.4.0 | Accurate in the blog; absent from the homepage |
| “Same mock and load driver on one host” | Blog | No machine type, core count, worker count, mock latency or concurrency for the overhead run | Cannot be reproduced from the text alone |
The verdict labels are narrow by design. “Not reproducible from published data” means the number exists somewhere but the files LiteLLM published do not let a reader arrive at it from the benchmark it is attributed to. “Mislabeled” means the number is in the files but the page describes it as a different measurement. “Unsupported” means no file read contains the figure. None of the labels says anything about intent.
How the claims were checked
Each claim was matched to the file that should produce it: the concurrency sweep for latency and throughput, the memory CSVs for RSS, the CPU CSVs for utilization, and the cost CSV for the per-dollar figures. A claim passes when the file reproduces it under the conditions the page or blog states.
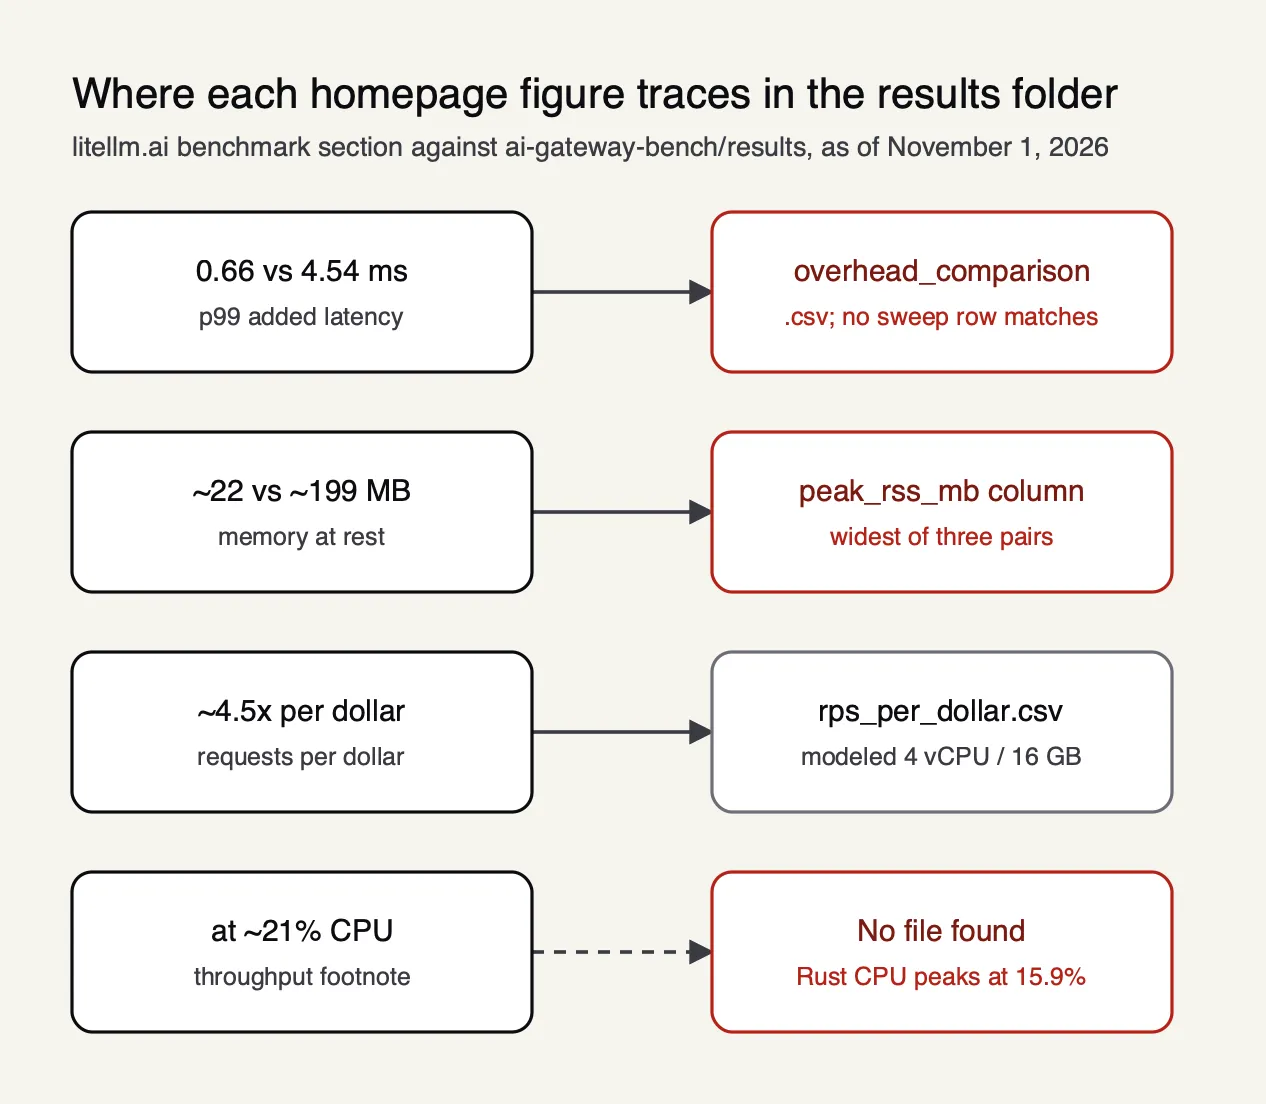 Figure 1: Two homepage figures trace to files with a different meaning, one to a cost model, and one to no file checked.
The evidence comes from three places LiteLLM controls. The first is the benchmark section of litellm.ai, which carries the tiles and footnotes. The second is the Rust AI gateway benchmark post on LiteLLM’s blog, which states the methodology and the caveats. The third is the results folder of the ai-gateway-bench repo, where LiteLLM’s blog says every plotted value is committed as a CSV.
The homepage and the blog make overlapping but different claims, so the table keeps them apart. Several of the problems below exist only on the homepage, where tiles drop the caveats the blog states. Where the blog and the homepage differ, the table says so. This matters for anyone quoting the numbers: the same “9x” means “peak memory” in one place and “memory at rest” in the other.
Every figure in this piece is dated November 1, 2026, the date the files were checked. LiteLLM can edit its homepage and blog at any time, and a later edit that changes a label would change a verdict. The repo’s commit history is the record for the files.
The 7x overhead claim
The 7x claim does not reproduce from LiteLLM’s own concurrency sweep. It rests on a 4.54 ms added-p99 figure for Bifrost that sits in overhead_comparison.csv, a file that states no concurrency level. In the sweep, Bifrost’s added p99 ranges from +0.63 ms to +28.68 ms, and no row is near 4.54 ms.
Added latency, or gateway overhead, is what LiteLLM’s blog defines as gateway latency minus direct-to-mock latency, charted as p99 added latency. A load driver calls a deterministic mock upstream directly, then calls the same mock through each gateway, and the difference at the 99th percentile is the overhead. That only means something when both runs share the same concurrency.
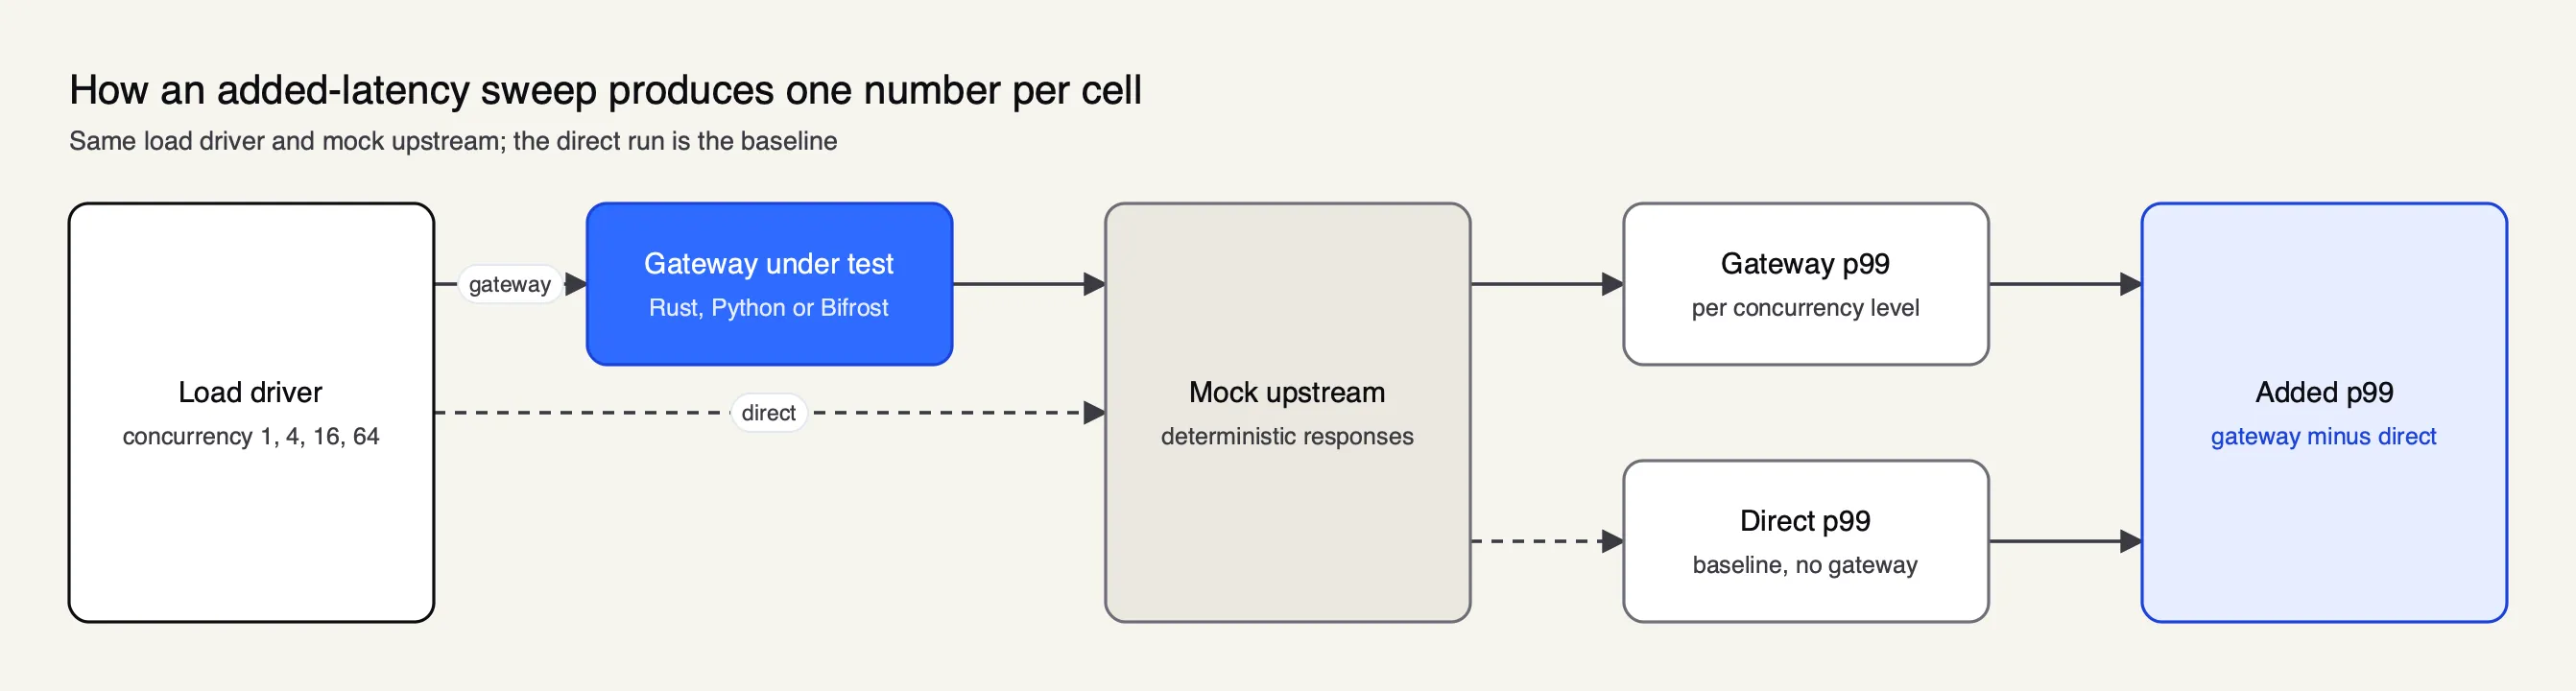 Figure 2: Added p99 is a difference between two runs at the same concurrency, so a headline overhead figure has to name the concurrency it came from.
The sweep file, latency_vs_concurrency.csv, records added p99 at four concurrency levels. All error counts are 0.
| Concurrency | Direct p99 (ms) | LiteLLM Rust | Bifrost | LiteLLM Python |
|---|---|---|---|---|
| 1 | 21.98 | +0.89 | +0.75 | +9.79 |
| 4 | 22.42 | +0.61 | +0.63 | +26.95 |
| 16 | 22.67 | +0.33 | +0.89 | +251.34 |
| 64 | 24.02 | +40.28 | +28.68 | +546.04 |
Added p99 latency over a direct call, in ms, lower is better. Source: LiteLLM’s latency_vs_concurrency.csv, as of November 1, 2026.
Read row by row, the sweep tells a mixed story rather than a 7x one. At concurrency 1, Bifrost adds +0.75 ms against Rust’s +0.89 ms. At concurrency 4 the gap is 0.02 ms, which is noise. At concurrency 16, Rust is lower by 0.56 ms (+0.33 against +0.89). At concurrency 64, Bifrost adds +28.68 ms against Rust’s +40.28 ms, about 29% less.
The concurrency-16 result is the one Rust can fairly claim. That 0.56 ms is 2.7x the added latency but about 2.4% of total p99. From concurrency 1 to 16, Bifrost adds under 4% of the roughly 22 ms direct p99, so at the low end both gateways sit within a fraction of a millisecond of a direct call.
The 4.54 ms figure itself is not invented. It is in overhead_comparison.csv as 4.544 ms, next to Rust’s 0.66 ms. The problem is that this file does not say what concurrency produced it, and the sweep, which does state concurrency, does not contain anything close. LiteLLM’s blog says the overhead panel used n=5000, but gives no mock latency or concurrency level for that run. A reader cannot get from the published sweep to 4.54 ms.
That is the basis for the “not reproducible from published data” verdict on both the homepage tile and the blog’s “roughly 7x lower overhead” line. The 6.9x ratio between 4.544 and 0.66 is a calculation from the file, not a figure on LiteLLM’s page. The Frontier Wire’s row-by-row trace of the 7x overhead figure follows the same sweep at each concurrency level.
The 3.5x line on the homepage
The homepage’s “3.5x lower overhead than the next AI gateway” is accurate arithmetic, but it is not a comparison with Bifrost. It compares Rust’s 0.66 ms with a different gateway on the same chart at 2.29 ms. Against Bifrost, the files give a different ratio, and the blog’s “roughly 7x” is that second comparison.
The two numbers are easy to conflate. A reader who sees “3.5x lower overhead” on the homepage and “roughly 7x lower overhead” in the blog could assume one is a rounding of the other, or that both describe the same pair. They describe two different gateways.
Taken on its own terms, the 3.5x line checks out: 2.29 divided by 0.66 is 3.5. The verdict is “accurate arithmetic, different comparison” because the claim is true as written and only misread if applied to Bifrost. Coverage that cites “3.5x faster than Bifrost” would be repeating a claim LiteLLM’s page does not make.
Memory at rest and peak RSS
The homepage labels its memory tile “memory at rest”, about 22 MB for Rust against about 199 MB for Bifrost. The files record those values in a column named peak_rss_mb: the figure is peak RSS, not memory at rest. The page also uses the widest of three Bifrost-to-Rust memory pairs in the repo. Rust is still smaller in every file.
Resident set size (RSS) is the amount of a process’s memory held in physical RAM at a moment in time. A benchmark samples it repeatedly during a run. Memory at rest is a reading taken while the process is idle; peak RSS is the highest reading taken at any point. The two can match for a process whose footprint never moves, and differ widely for one that grows under load.
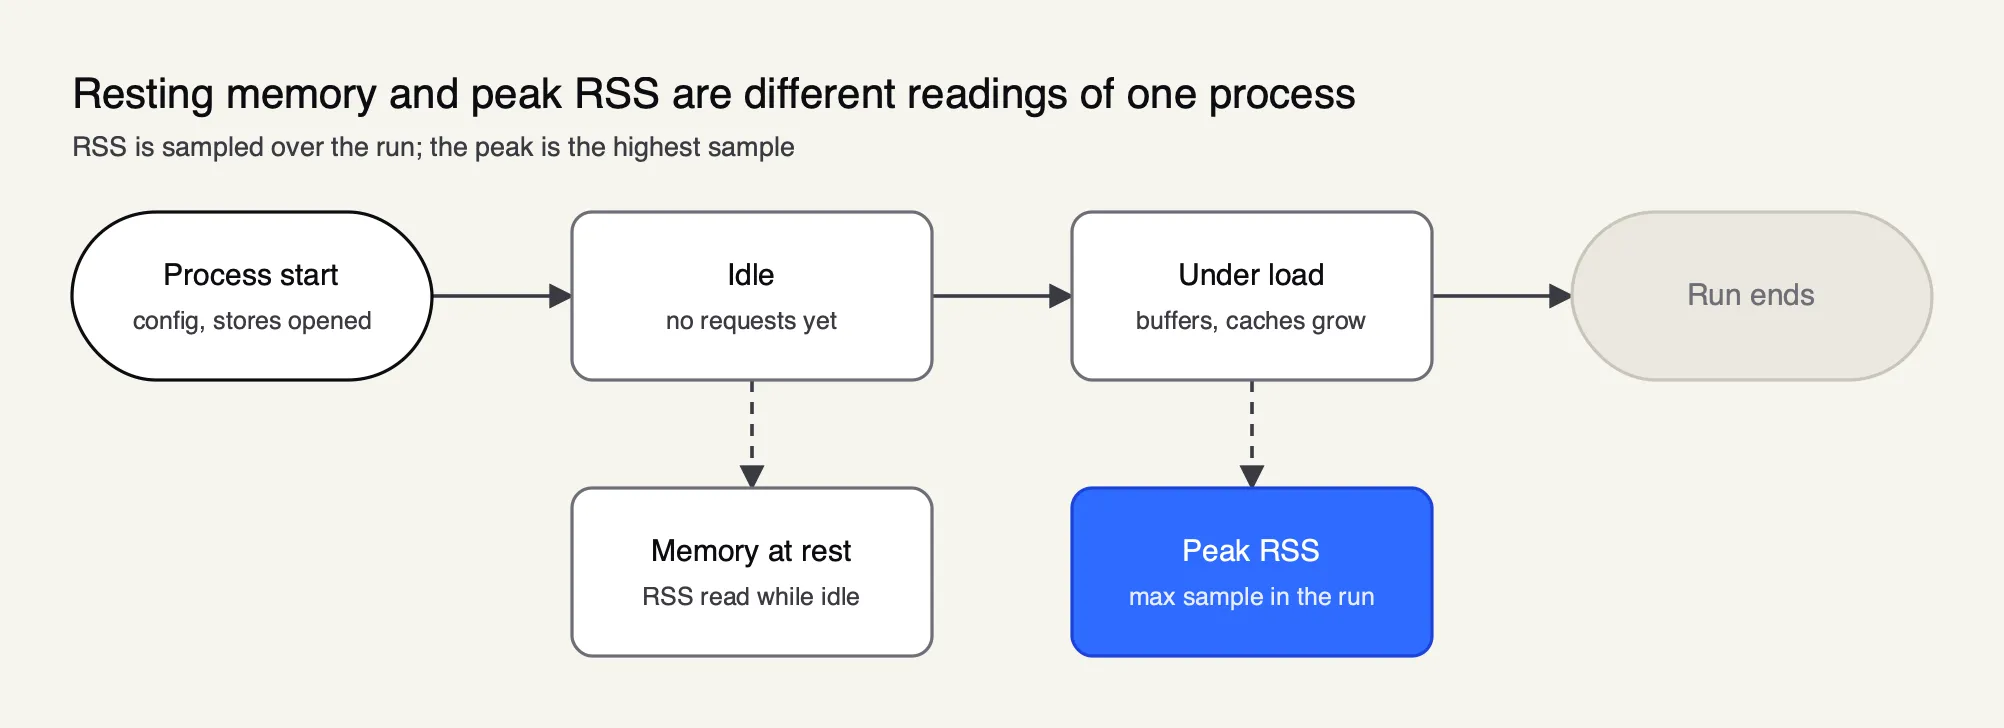 Figure 3: A column named peak_rss_mb records the highest sample, which is not the same measurement as memory with the gateway idle.
The homepage chart uses three descriptions at once. Its heading pairs “memory at rest” with “peak RSS”, and its note says “resident memory with the gateway idle.” The column in the files is peak_rss_mb. The problem is the label, not the headline: Rust’s footprint is smaller whichever term is used.
The repo holds three Bifrost-to-Rust memory pairs, all from files in the results folder:
| Files | Bifrost | LiteLLM Rust | Ratio |
|---|---|---|---|
| mem_bifrost_messages.csv, mem_litellm_rust_release.csv | 199.1 MB | 21.8 MB | 9.1x |
| mem_bifrost.csv, mem_litellm_rust.csv | 144 MB | 26.1 MB | 5.4x |
| cpu_bifrost.csv, cpu_rust.csv | 282 to 298 MB | 35 to 36 MB | 8.3x |
Memory pairs in LiteLLM’s results files, as of November 1, 2026.
The homepage and the blog both use the first pair, the widest. The difference within it is 177.3 MB. The pairs may come from different scenarios or builds, which is why the choice of pair is context here rather than the main finding.
The blog uses the term that matches the column. It reports “21.8MB peak memory against 199.1MB” and calls the ratio “9x less memory” than “the next-closest gateway (Bifrost).” That row in the table is marked accurate. Anyone citing the memory figure should use the blog’s wording, not the homepage’s.
What the gap is made of is a separate question the files cannot answer. Bifrost’s RSS is already about 282 MB before the first request in cpu_bifrost.csv, and load adds only about 16 MB. That points primarily to a baseline footprint rather than growth in a log buffer, though RSS alone cannot identify which components account for it. SQLite’s caches and connection state may contribute, but the files do not quantify that contribution or isolate logging’s share of the gap. The configuration section below covers why SQLite is in the picture at all.
The blank throughput cell
The homepage throughput tile shows Rust at “2,800+ req/s” and a dash where Bifrost’s number would be. The files show both: 2,814 against 2,744 req/s in the cost file, and 2,722.2 against 2,719.1 in the sweep at concurrency 64. The blank cell hides a gap of 2.5% or less.
The sweep’s throughput columns show the two gateways tracking each other at every level:
| Concurrency | Direct | LiteLLM Rust | Bifrost | LiteLLM Python |
|---|---|---|---|---|
| 1 | 46.2 | 45.2 | 44.8 | 34.4 |
| 4 | 184.5 | 181.2 | 180.2 | 92.7 |
| 16 | 735.6 | 721.8 | 722.7 | 158.4 |
| 64 | 2,855.7 | 2,722.2 | 2,719.1 | 179.8 |
Requests per second, higher is better. Source: LiteLLM’s latency_vs_concurrency.csv, as of November 1, 2026.
Every Bifrost-to-Rust gap in the sweep is under 1%. At concurrency 64, Bifrost keeps 95.2% of direct throughput and Rust keeps 95.3%, a 0.1% difference. With one run per cell and no confidence intervals, these gaps are noise.
The second file, rps_per_dollar.csv, records a sustained rate of 2,814 req/s for Rust and 2,744 for Bifrost, a gap of 2.5%. That is the widest the files show. The verdict is “incomplete” because the tile’s dash leaves a reader to infer that Bifrost has no comparable number, when the repo holds two.
The sweep also places LiteLLM’s own Python proxy in context. It adds 546 ms of p99 at concurrency 64, about 13.6x the Rust port, and reaches about 180 RPS, 6% of direct. Read as a whole, the throughput data shows LiteLLM Rust catching up to where Bifrost already was, not Rust beating Bifrost.
The CPU footnote and “single client”
Two homepage footnotes do not match the files. The “at ~21% CPU” figure appears in none of the CPU, throughput, cost or overhead files checked; Rust’s CPU file peaks at 15.9%. The “single client” note does not describe a sweep that runs from concurrency 1 to 64.
The CPU files are cpu_rust.csv and cpu_bifrost.csv. Rust records a mean of 0.66% and a peak of 15.9%. Bifrost records a mean of 2.59% and a peak of 79.5%. Both are averaged over a 30-second window, of which about 2.3 seconds is active.
None of those is ~21%. That finding has a limited scope: the figure is absent from the files checked, which are not every file in results/. The verdict is “unsupported” on that basis.
One further inference is unconfirmed. The CPU samples appear to come from a short burst, probably the concurrency-16 cost runs of 1,000 requests, in which Bifrost recorded p50 22.99 ms and p99 262.4 ms and Rust recorded p50 22.48 ms and p99 263.9 ms. If so, the homepage pairs a CPU figure with a different load than the 2,800 req/s it is printed beside.
The “single client” footnote has a firmer problem. It is misleading: the sweep runs at concurrency 1 to 64, and the throughput figure on the page comes from a run with ceiling_concurrency = 64. That is many connections at once, not one client sending requests one at a time. The table records it as “not supported as stated.”
Requests per dollar and the cost model
The “~4.5x more requests per dollar” claim is accurate arithmetic: 283,833 divided by 63,246 requests per dollar-hour gives 4.5x. It is also a model rather than a measurement. Its inputs assume a 4 vCPU / 16 GB instance that is not the benchmark machine, and LiteLLM’s materials carry three different cost ratios.
This is the row where the published data is most consistent with the claim, and a fair fact check should say so. The numbers in rps_per_dollar.csv produce the homepage figure exactly. What the homepage does not show is how those numbers were made.
LiteLLM’s blog describes the method as “estimated USD per one million requests from measured CPU, peak RSS, and sustained throughput on a 4 vCPU / 16 GB instance,” and notes that it “excludes token cost.” The cost is derived from resource measurements and an assumed instance, not observed on a bill. The “4 vCPU / 16 GB” appears only in the cost model; no hardware is stated for the benchmark runs themselves.
The three ratios in LiteLLM’s materials measure different things:
| Metric | LiteLLM Rust | Bifrost | Ratio | Where |
|---|---|---|---|---|
| Requests per dollar-hour | 283,833 | 63,246 | ~4.5x | Homepage, rps_per_dollar.csv |
| Cost per million requests | $0.000175 | $0.001008 | “roughly 6x” (about 5.8x) | Blog |
| Modeled hourly cost | $0.0099 | $0.0434 | 4.4x | rps_per_dollar.csv |
Cost figures in LiteLLM’s homepage, blog and results files, as of November 1, 2026. All are modeled on an assumed 4 vCPU / 16 GB instance.
The blog’s “roughly 6x” is about 5.8x when computed from its own two numbers, and it is a per-million-request metric, not the per-dollar-hour metric behind the homepage’s 4.5x. Both cost rows in the table are “accurate arithmetic, modeled inputs.” There is one more input to note: the Bifrost run’s resource measurements include the cost of its default logging, which the next section covers.
Logging on, logging off
LiteLLM’s blog says every gateway ran “with no logging callbacks, spend tracking, or persistence enabled.” The Bifrost configuration it published points at the shared mock upstream, disables the config store and lists no plugins, but never sets enable_logging or a log store. In Bifrost’s code, both default to on. That finding is inferred from v2.4.0 code and not yet confirmed on v1.6.4.
The Bifrost config in the ai-gateway-bench repo sets config_store: enabled: false and no plugins. Here is what the gateway does with that config. enable_logging defaults to true when unset. With no logs_store configured, Bifrost creates a default SQLite log store. The logging plugin is built in, so “no plugins” in the config does not turn it off, and disabling the config store leaves the log store and plugins running.
Bifrost’s documentation describes the same switches. Its page on built-in observability describes enable_logging as the master toggle for request tracing and disable_content_logging as the option that skips request and response bodies. The client configuration reference lists disable_content_logging with a default of false, so bodies are logged unless it is set. The log store architecture page names SQLite as the default backend.
The SQLite store has a memory footprint of its own. Bifrost v1.6.4 opens a disk-backed logs.db at startup and configures a cache_size of 10,000 pages per connection, approximately 39.1 MiB at a 4 KiB page size. The SQLite documentation on cache_size treats that as a suggested limit, and the cache grows on demand rather than being preallocated. It can still add to baseline RSS before any benchmark traffic, by an amount the files do not quantify.
The log writer adds bounded buffering. In v1.6.4, the writer configuration flushes at 1,000 entries, 5 seconds from the first entry, or 300 MiB of estimated payload, whichever comes first, with a 10,000-entry queue. That brings queue-plus-batch capacity to approximately 11,000 entries. These are entry-count bounds, not a total memory cap.
One limit applies: the LiteLLM Rust config was not inspected. The two configurations performed different work, so the CPU and memory comparisons describe the tested setups, not equal-feature performance. A controlled rerun with logging off and on is needed to measure how much logging contributes; The Frontier Wire’s look at why logging settings matter in a gateway benchmark sets out what such a rerun would test. Disabling logging alone does not remove other plugins’ hooks; telemetry and governance plugins load by default too.
Versions on both sides
LiteLLM’s blog names the versions it tested: the LiteLLM Rust beta, LiteLLM Python v1, Bifrost v1.6.4 and the current open-source build of one other gateway. The homepage shows no versions. Bifrost’s changelogs list v1.6.5 to v1.6.11 and then v2.0.0 to v2.4.0 after the tested build, so the benchmarked release is several versions old. The Frontier Wire covers the wider version problem in software benchmarking separately.
The blog is accurate about its own versions, and the table marks it so. It also states that the Rust gateway is “an early beta” and that “streaming and the full feature surface are still landing.” The comparison is between a Rust beta without streaming and an older Bifrost build, a detail visible only in the blog and the Bifrost gateway README in the repo.
The README adds one more detail about the Bifrost run. Bifrost was called on its native /anthropic/v1/messages route, because v1.6.4 does not mount that integration at /v1/messages, and no proxy rewrite was used. The blog names no Python v1 version number and no hardware.
Two version facts change how a reader should apply the numbers. On the Bifrost side, Bifrost 2.x is reported to have since substantially reduced memory use, which the v1.6.4 benchmark does not reflect; no figure has been published, and one is deferred to Part 2. On the LiteLLM side, the Rust gateway is a partial migration. LiteLLM’s tracker reports 24% of Major APIs built as of v1.107.0-rc.2 (35.4 of 146 weighted engineering points). The Rust gateway documentation warns that the Python proxy on main:latest uses Rust for /ocr across providers and /audio/transcriptions for Bedrock, and that other routes, including Messages and Chat Completions, run on Python.
The benchmark therefore measures a narrower Rust beta, not the LiteLLM product most teams deploy. A team weighing these numbers should compare the versions it would actually run. The Frontier Wire’s survey of LiteLLM alternatives covers that decision from the deployment side, and the vendor’s feature-by-feature comparison of LiteLLM and Bifrost covers it from the feature side.
Hardware, error bars and reproducibility
LiteLLM’s blog states its limits plainly: single-host, per-scenario runs without repeated-trial error bars, to be treated as order-of-magnitude differences, in a vendor-run benchmark. That caveat is accurate and matches the files. The homepage tiles do not repeat it, and the files themselves show why it matters.
The blog’s exact words are “Single-host, per-scenario runs (for example n=5000 on the overhead panel) without repeated-trial error bars, so treat them as order-of-magnitude differences. It is a vendor-run benchmark.” The table marks this row accurate. It is the most useful sentence in LiteLLM’s materials for anyone deciding how much weight to give the numbers.
The files demonstrate the problem the caveat describes. Total p99 at concurrency 64 is 52.7 ms for Bifrost and 64.3 ms for Rust in the sweep, but 32.2 ms for Bifrost and 26.9 ms for Rust in rps_per_dollar.csv. The ranking flips between two of LiteLLM’s own files at the same concurrency. With single runs, small gaps are not stable, and no file supports a 7x latency gap at low concurrency.
The Frontier Wire has covered the same statistical issue in a different field: small benchmarks with single runs cannot separate close results, and repeated trials with published intervals are what make a gap meaningful. A gateway benchmark is subject to the same arithmetic.
The homepage’s reproducibility claims are thinner than the blog’s. It says “Identical hardware” and “Run it yourself”, and offers a “See the benchmark” link. No machine type, core count or worker count is given for either gateway, and the link goes to the in-page #benchmark anchor rather than to the raw data or a methodology document. The blog’s “same mock and load driver on one host” names no machine type, core count, worker count, mock latency or concurrency for the overhead run. Both rows are marked “cannot be checked” or “cannot be reproduced from the text alone.”
The blog also does not mention that concurrency 256 was dropped from the sweep. The repo’s top-level README does. For a vendor’s view of the wider category, the vendor behind Bifrost publishes a builder’s guide to LLM gateways and their benchmarks, which carries the same caveat as any vendor-authored comparison.
Where the files favor Rust
The files credit LiteLLM’s Rust gateway with real advantages. It uses less memory in every file, less CPU on both mean and peak, and it leads at concurrency 256 in an exploratory run. These are the results that hold, and they do not depend on the homepage’s labels.
On memory, Rust’s highest figure in any file, about 36 MB, is below Bifrost’s lowest, about 144 MB. Whatever share of Bifrost’s footprint comes from logging or SQLite, which the files do not establish, the Rust process is smaller.
On CPU, Bifrost averages 2.59% (peak 79.5%) against Rust’s 0.66% (peak 15.9%), approximately 3.9x the mean and 5x the peak. These are whole-process measurements under the configurations described above. The files do not separate request handling from background work such as log writes.
At concurrency 256, LiteLLM dropped the run from the sweep because the direct baseline’s p99 exceeded twice the single-client floor, according to the repo README. The JSON files are still in results/. They show Rust ahead:
| Metric at concurrency 256 | Direct | LiteLLM Rust | Bifrost | LiteLLM Python |
|---|---|---|---|---|
| p50 (ms) | 48.1 | 55.5 | 89.3 | 1,513 |
| p99 (ms) | 434.8 | 2,667.8 | 5,421.3 | 10,733.6 |
Exploratory: one run of 5,000 requests per gateway, no errors and no RPS field. Source: c256 JSON files in LiteLLM’s results folder, as of November 1, 2026.
Rust is about 1.6x better than Bifrost at p50 and about 2.0x better at p99 in this run. The caveat travels with the numbers: with the direct baseline already outside the benchmark’s own threshold, it is an exploratory result rather than a reliable capacity comparison.
These wins are why the fact check concentrates on labels and sources rather than direction. Rust is smaller and lighter on CPU in the tested setups. The question the table answers is whether the specific multipliers on the homepage, 7x, 9x at rest and 4.5x per dollar, follow from the files as described.
What to take from the fact check
The defensible summary of LiteLLM’s benchmark claims is narrower than the homepage. Rust uses less memory and CPU in the tested configurations. Latency and throughput against Bifrost are close and mixed. The 7x overhead figure does not come from the sweep, and the homepage’s memory figure uses the widest pair and labels peak RSS as memory at rest.
For an engineer reading any gateway benchmark, the useful checks are the ones this table applied:
- Find the sweep. A single overhead number should trace to a row with a stated concurrency. If it does not, ask where it came from.
- Check the memory term. Peak RSS and resting memory are different measurements, and a process can look very different on each.
- Separate measured from modeled. Per-dollar figures built on an assumed instance are estimates of cost, not observations of it.
- Compare configurations. Logging, persistence and plugins change both CPU and memory. Two gateways doing different work produce a comparison of setups, not of engines.
- Look for repeats. Without repeated trials and error bars, gaps of a few percent are noise, and the files here show a ranking that flips between two of them.
- Note the versions. A beta without streaming against an older build of the other gateway tells a reader little about the releases they would deploy.
A planned Part 2 follow-up will rerun both gateways with logging off and on, on a current Bifrost build, with repeated trials, error bars, published hardware, worker counts, mock latency and concurrency for every run, and heap profiles to measure how much of the memory gap is the log buffer. That is the test that would settle the open questions here, including the share of Bifrost’s memory that logging accounts for. Until it publishes, the files support the narrower claims above.
Teams evaluating gateways now can run the same kind of test on their own traffic. The Frontier Wire’s guide to LiteLLM alternatives includes a week-long test plan built around mirrored traffic and p99, and its survey of open-source AI gateways lists the self-hostable options. For gateway-level logging and its costs, the LLM observability explainer covers what a logging path records.
The same vendor also publishes a guide to migrating from LiteLLM to Bifrost, a comparison for high-throughput workloads and a LiteLLM alternative resource page; each is the vendor’s own account and should be read as one.
LiteLLM’s published files are what make this fact check possible. A vendor that commits its raw data invites exactly this kind of reading, and the accurate rows in the table, the 4.5x arithmetic, the blog’s “peak memory” and its single-host caveat, show the method working as it should. The remaining rows are a matter of labels and sources that LiteLLM can revise on its page.
Source: Debunking LiteLLM Rust Benchmarking: Part 1, by Akshay Deo of Maxim AI, which builds the Bifrost gateway.
Sources
- Debunking LiteLLM Rust Benchmarking: Part 1 (Akshay Deo, Maxim AI, November 1, 2026)
- LiteLLM homepage, benchmark section
- LiteLLM blog: Rust AI gateway benchmarks
- LiteLLM docs: Rust gateway
- BerriAI/ai-gateway-bench: results folder
- ai-gateway-bench: latency_vs_concurrency.csv
- ai-gateway-bench: overhead_comparison.csv
- ai-gateway-bench: rps_per_dollar.csv
- ai-gateway-bench: cpu_bifrost.csv
- ai-gateway-bench: cpu_rust.csv
- ai-gateway-bench: Bifrost gateway README and config
- Bifrost source: SQLite log store setup
- Bifrost source: log store writer configuration
- SQLite documentation: PRAGMA cache_size
Questions readers ask
Are LiteLLM's benchmark claims accurate?
Some are and some are not, checked against LiteLLM's own files as of November 1, 2026. The 4.5x requests-per-dollar arithmetic holds, the blog calls its memory figure peak memory, matching the data column, and it states its single-host, no-error-bar caveat. The 4.54 ms Bifrost overhead behind the 7x claim appears in no row of the concurrency sweep, the homepage labels a peak RSS figure memory at rest, and the ~21% CPU figure appears in no file checked.
Is LiteLLM's Rust gateway faster than Bifrost?
Not by the margin the homepage states. In LiteLLM's own latency sweep, Bifrost adds less p99 latency at concurrency 1 (+0.75 ms vs +0.89 ms) and 64 (+28.68 ms vs +40.28 ms), Rust adds less at 16 (+0.33 ms vs +0.89 ms), and concurrency 4 is a 0.02 ms gap. Throughput at concurrency 64 is 2,722.2 RPS for Rust and 2,719.1 for Bifrost. Each cell appears to be a single run.
Does LiteLLM's Rust gateway use less memory than Bifrost?
Yes, in every file. Rust's highest memory figure, about 36 MB, is below Bifrost's lowest, about 144 MB. The homepage's 9x figure uses the widest of three memory pairs, 199.1 MB against 21.8 MB, and labels it memory at rest, but the data is peak RSS. Bifrost was tested as v1.6.4, apparently with logging at its default of on (inferred from v2.4.0 code, not confirmed on v1.6.4), and the files do not isolate that effect.
Is the 4.5x requests-per-dollar figure a measurement?
No. It is a model. The arithmetic holds (283,833 divided by 63,246 requests per dollar-hour is about 4.5x), but the inputs assume a 4 vCPU / 16 GB instance rather than the benchmark machine. LiteLLM's blog gives a different ratio, roughly 6x (about 5.8x) per million requests, and the hourly cost model gives 4.4x.
Were LiteLLM and Bifrost benchmarked with the same settings?
The published configuration suggests not. LiteLLM's blog says every gateway ran with no logging callbacks, spend tracking or persistence. The Bifrost config it used never sets enable_logging or a log store, and in Bifrost's code those default to logging on with a SQLite store. That finding is inferred from v2.4.0 code and not yet confirmed on the v1.6.4 build that was tested.