
LiteLLM vs Bifrost latency: tracing the 7x overhead figure
LiteLLM says its Rust gateway has roughly 7x lower overhead than Bifrost. The concurrency sweep in LiteLLM's own benchmark repo shows Bifrost lower at concurrency 1 and 64, Rust lower at 16, a tie at 4, and throughput gaps under 1%. The headline number comes from a separate file with no stated concurrency.
LiteLLM says its new Rust gateway has “roughly 7x lower overhead” than the next-closest AI gateway, and that headline number does not come from the concurrency sweep in LiteLLM’s own benchmark repo. On LiteLLM vs Bifrost latency, the sweep, as of November 1, 2026, shows Bifrost adding less p99 latency at concurrency 1 and 64, Rust adding less at 16, and the two tied at 4. The 7x rests on a 4.54 ms figure that no row of the sweep reproduces.
TL;DR
- LiteLLM’s blog says its Rust gateway adds “about 0.7ms at p99 against 4.5ms” for Bifrost, “roughly 7x lower overhead”. Both figures come from overhead_comparison.csv, which states no concurrency level.
- On LiteLLM vs Bifrost latency, the repo’s concurrency sweep has LiteLLM Rust adding +0.89, +0.61, +0.33 and +40.28 ms of p99 at concurrency 1, 4, 16 and 64, against +0.75, +0.63, +0.89 and +28.68 ms for Bifrost. No row is near 4.54 ms.
- The homepage line “3.5x lower overhead than the next AI gateway” compares against a different gateway at 2.29 ms, not against Bifrost.
- Throughput at concurrency 64 is 2,722.2 requests per second for Rust and 2,719.1 for Bifrost, about 0.1% apart. The LiteLLM Python proxy reaches 179.8.
- Each cell appears to be a single run with no error bars, and the configurations differed, so small gaps in either direction are not stable.
The 7x overhead claim and where it appears
LiteLLM makes two different overhead claims in two places. Its benchmark blog says the Rust gateway has “roughly 7x lower overhead and 9x less memory than the next-closest gateway (Bifrost)”. Its homepage says Rust adds 0.66 ms at p99, “3.5x lower overhead than the next AI gateway”. They compare Rust against different gateways.
The blog’s version is specific. For overhead, it reports Rust at “about 0.7ms at p99 against 4.5ms” for Bifrost, on its gateway overhead and memory panel. The LiteLLM benchmark blog post defines overhead as gateway latency minus direct-to-mock latency and charts it as p99 added latency. The homepage’s benchmark section on litellm.ai shows a tile table with LiteLLM (Rust) at 0.66 ms, another gateway at 2.29 ms and Bifrost at 4.54 ms.
As of November 1, 2026, those homepage figures trace to a single file in LiteLLM’s public ai-gateway-bench results directory: overhead_comparison.csv, which lists 4.544 ms for Bifrost and 0.66 ms for Rust. The resulting 6.9x ratio is not printed on the page; the blog rounds it to “roughly 7x”.
That file is not the only latency data LiteLLM publishes. The same directory holds latency_vs_concurrency.csv, a sweep that measures every gateway at four concurrency levels. Understanding why the two files disagree starts with what the metric measures.
What added p99 over direct measures
Added p99 latency over direct is the p99 latency of requests sent through a gateway, minus the p99 latency of the same requests sent straight to the upstream. It isolates what the gateway contributes to the slowest 1% of requests, as long as both runs use the same load, the same upstream and the same host.
The p99 is the 99th percentile of response times: 99% of requests completed at or below it, and 1% took longer. Engineers use it because averages hide the tail. A service can have a fast median and still leave one request in a hundred waiting far longer, and in a system that fans one user action out into many calls, the slow tail is what users feel. The p50, or median, describes the typical request; the p99 describes the bad case.
LiteLLM’s benchmark points every gateway at the same deterministic mock upstream, which the homepage describes, and runs the same load driver on one host, which the blog describes. A mock returns the same response with predictable timing, so the model’s own latency is removed from the measurement. What remains is the time spent in the client, the network on that host, and the gateway.
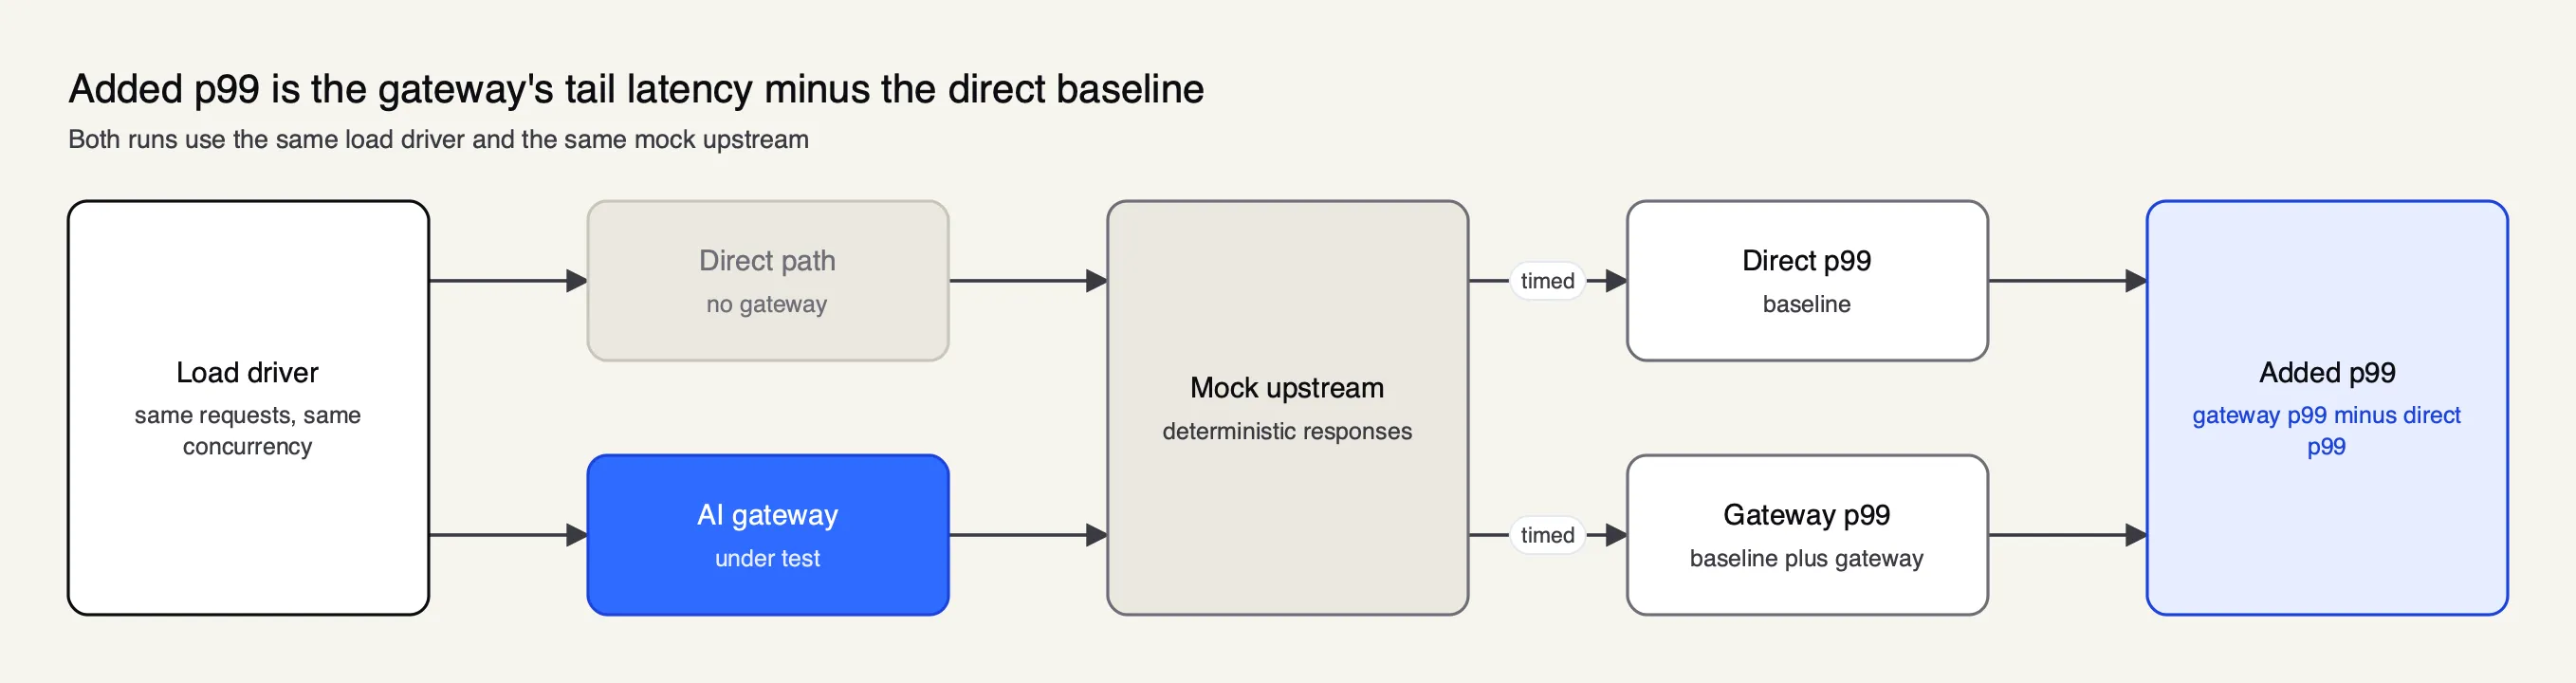
Figure 1: Added p99 isolates what the gateway contributes to the slowest 1% of requests, because the upstream is identical in both runs.
As Figure 1 shows, the subtraction only works if the direct run and the gateway run are comparable. Three conditions matter for anyone reading the numbers:
- Same concurrency. Tail latency rises as more requests are in flight, for the direct path and for the gateway. A gateway figure measured at one load level and a direct figure at another produce a meaningless difference.
- Same work. If one gateway logs every request to disk and another does nothing beyond forwarding, the added p99 includes that extra work. The number is still real, but it describes the configuration, not the language or the architecture.
- Enough runs. A percentile from one run moves between runs. Small differences between gateways need repeated trials and error bars before they mean anything.
The sweep file in LiteLLM’s repo publishes the direct p99, the gateway p99 and the difference for each gateway at each level. That makes it the most complete public record of gateway overhead in the benchmark.
How a concurrency sweep works
A concurrency sweep runs the same benchmark at several load levels and records one results row per gateway per level. Concurrency is the number of requests kept in flight at once. LiteLLM’s sweep covers concurrency 1, 4, 16 and 64, and records direct p99, gateway p99, added p99, throughput and error counts.
The point of a sweep is to show the shape of the curve. At concurrency 1, each request runs alone, so the added p99 reflects the gateway’s per-request path with little contention. As concurrency rises, queueing, scheduling and any background work inside the gateway begin to compete with request handling. A gateway that looks fast at one level can degrade sharply at the next, and the opposite can happen too.
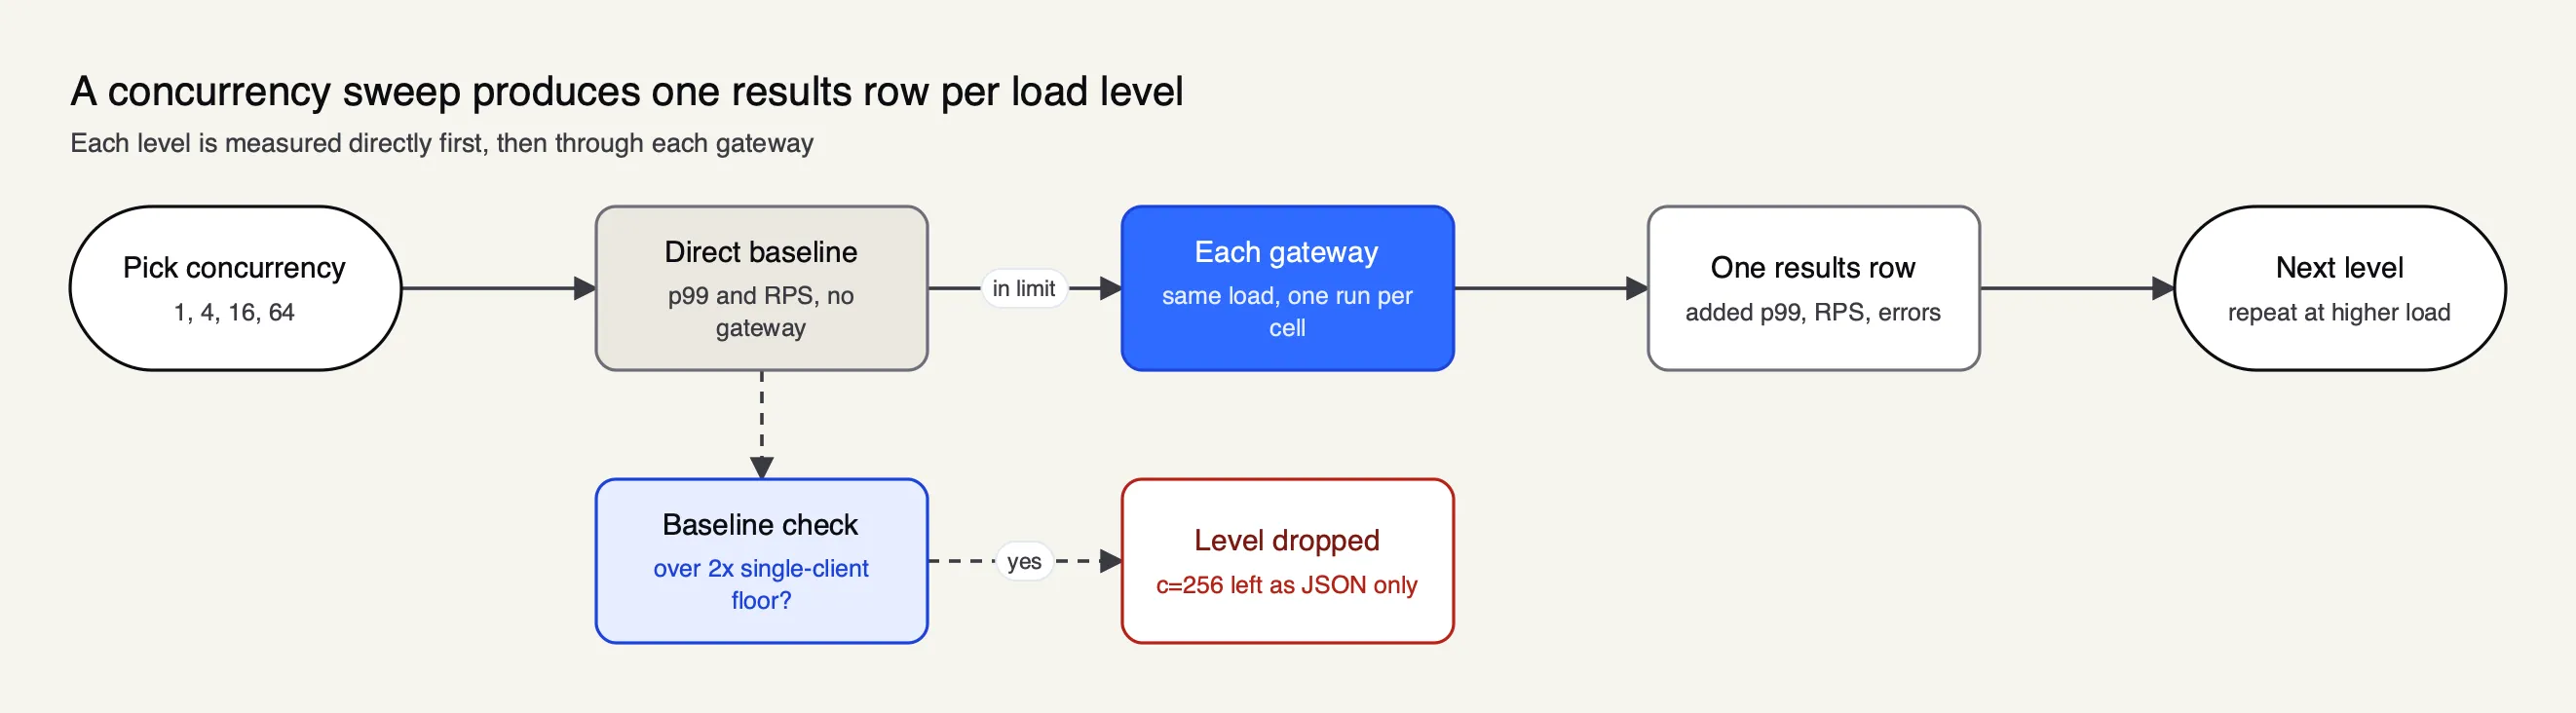
Figure 2: A sweep shows how overhead changes as requests in flight rise, so a single figure without its concurrency level cannot be placed on the curve.
LiteLLM’s sweep also had a fifth level. According to the repo’s top-level README, concurrency 256 was dropped from the sweep because the direct baseline’s p99 at 256 exceeded twice the single-client floor. That is a reasonable rule: if the direct path is already saturated, the subtraction no longer isolates the gateway. A c256 JSON file for each gateway still sits in the results directory, and it is covered later in this piece.
Two limits apply to the sweep as published. The sweep file carries only p99; the per-run JSON files in results/ also carry p50. And each cell appears to be a single run, since no repeats or error bars are published. Every number in the sweep is therefore one measurement, not an average of several.
The added-p99 sweep, row by row
LiteLLM’s concurrency sweep shows no consistent winner between its Rust gateway and Bifrost. As of November 1, 2026, Bifrost adds less p99 latency at concurrency 1 and 64, Rust adds less at 16, and the gap at 4 is 0.02 ms. All error counts are 0. No row shows a 7x gap in Rust’s favour.
The table reproduces the file’s figures, in milliseconds, with lower values better.
| Concurrency | Direct p99 | LiteLLM Rust (added) | Bifrost (added) | LiteLLM Python (added) |
|---|---|---|---|---|
| 1 | 21.98 | +0.89 | +0.75 | +9.79 |
| 4 | 22.42 | +0.61 | +0.63 | +26.95 |
| 16 | 22.67 | +0.33 | +0.89 | +251.34 |
| 64 | 24.02 | +40.28 | +28.68 | +546.04 |
Source: latency_vs_concurrency.csv in BerriAI/ai-gateway-bench, as of November 1, 2026.
Concurrency 1
With one request in flight, the direct p99 is 21.98 ms. LiteLLM Rust adds +0.89 ms and Bifrost adds +0.75 ms, the lower of the two. This is the row closest to a pure per-request cost, because there is no contention between requests.
Concurrency 4
At four requests in flight, the direct p99 is 22.42 ms. Rust adds +0.61 ms and Bifrost +0.63 ms. The 0.02 ms gap is noise, the only defensible reading of a single-run difference that small.
Concurrency 16
This is Rust’s strongest row. The direct p99 is 22.67 ms, Rust adds +0.33 ms and Bifrost +0.89 ms. Stated plainly, Rust’s added p99 is 0.56 ms lower, which is 2.7x the added latency but about 2.4% of total p99. Both framings are accurate. The ratio is large because both numbers are small; the absolute difference is a little over half a millisecond against a baseline of roughly 22 ms.
Across concurrency 1 to 16, Bifrost adds +0.75, +0.63 and +0.89 ms, under 4% of the roughly 22 ms direct p99.
Concurrency 64
At the highest level in the sweep, the picture changes. The direct p99 rises to 24.02 ms, and both gateways add tens of milliseconds: Rust +40.28 ms, Bifrost +28.68 ms. The Bifrost figure is about 29% less than Rust’s, in the row with the largest added p99 for both gateways.
The 4.54 ms figure no row reproduces
The homepage’s 4.54 ms for Bifrost comes from overhead_comparison.csv, a file that states no concurrency level. In the concurrency sweep, the same gateway’s added p99 is +0.75, +0.63, +0.89 and +28.68 ms. None is near 4.54 ms. The 7x claim is not reproducible from LiteLLM’s own sweep.
The comparison is direct. The homepage tile reads Bifrost 4.54 ms and Rust 0.66 ms. The overhead file reads 4.544 and 0.66. The sweep, which publishes its concurrency for every row, sits between +0.63 and +0.89 ms at concurrency 1 to 16 for the same gateway, and at +28.68 ms at 64. The 4.54 ms value sits between those ranges and matches no published row.
The blog gives some context for the overhead panel. It describes “single-host, per-scenario runs (for example n=5000 on the overhead panel) without repeated-trial error bars” and tells readers to “treat them as order-of-magnitude differences”. The blog gives no mock latency or concurrency level for the overhead run, and no machine type, core count or worker count for any gateway. Without the concurrency, a reader cannot place the 4.54 ms figure on the sweep’s curve or check it against the sweep at all.
| What is published | Bifrost | LiteLLM Rust | Concurrency stated |
|---|---|---|---|
| Homepage tile | 4.54 ms | 0.66 ms | No |
| overhead_comparison.csv | 4.544 ms | 0.66 ms | No |
| Blog text | “4.5ms” | “about 0.7ms” | No |
| Sweep, c=1 | +0.75 ms | +0.89 ms | Yes |
| Sweep, c=4 | +0.63 ms | +0.61 ms | Yes |
| Sweep, c=16 | +0.89 ms | +0.33 ms | Yes |
| Sweep, c=64 | +28.68 ms | +40.28 ms | Yes |
Sources: litellm.ai, the LiteLLM benchmark blog and BerriAI/ai-gateway-bench, as of November 1, 2026.
The table makes the gap in the record visible. Every figure with a stated concurrency shows the two gateways close together, with the lead changing hands. The only figures that support a 7x gap are the ones without a stated concurrency. No file supports a 7x latency gap at low concurrency.
That verdict is narrower than “the number is wrong”. The overhead file exists and contains 4.544. What the published data does not allow is any check of where that measurement came from, or any reconciliation with the sweep that the same repo publishes. A claim that cannot be traced to its conditions is not supported as stated.
The 3.5x comparison against the next gateway
The homepage’s “3.5x lower overhead than the next AI gateway” is not a comparison with Bifrost. The next gateway on the homepage chart is a different gateway at 2.29 ms, and 2.29 divided by 0.66 is 3.5. The blog’s “roughly 7x” against Bifrost is a separate comparison drawn from the same overhead file.
The distinction matters because the two claims are easy to blend. A reader who sees “3.5x lower overhead than the next AI gateway” in the homepage headline, and a table directly underneath with Bifrost at 4.54 ms, could reasonably assume the 3.5x refers to that entry. It does not: on the chart, the 2.29 ms gateway sits between the two.
The 3.5x is not a Bifrost number: the page’s 3.5x and the blog’s “roughly 7x” are two different comparisons. Against Bifrost, the overhead file gives 6.9x. Against the 2.29 ms gateway, it gives 3.5x. Neither figure states a concurrency level, so neither can be checked against the sweep in the way the previous section describes.
For engineers comparing gateways, the practical point is to read every multiplier with its denominator. “Next AI gateway” depends on which gateways a vendor chose to test, in what configuration, at what load.
Throughput at concurrency 64
Throughput is where the two compiled gateways are closest. At concurrency 64, as of November 1, 2026, the sweep records 2,855.7 requests per second direct, 2,722.2 for LiteLLM Rust and 2,719.1 for Bifrost, about 0.1% apart. Every throughput gap between the two in the sweep is under 1%.
| Concurrency | Direct | LiteLLM Rust | Bifrost | LiteLLM Python |
|---|---|---|---|---|
| 1 | 46.2 | 45.2 | 44.8 | 34.4 |
| 4 | 184.5 | 181.2 | 180.2 | 92.7 |
| 16 | 735.6 | 721.8 | 722.7 | 158.4 |
| 64 | 2,855.7 | 2,722.2 | 2,719.1 | 179.8 |
Requests per second, higher is better. Source: latency_vs_concurrency.csv, as of November 1, 2026.
At concurrency 64, Bifrost keeps 95.2% of direct throughput and Rust 95.3%, and with one run per cell and no confidence intervals, these gaps are noise. At concurrency 16, the order reverses by a fraction: 722.7 against Rust’s 721.8.
The homepage presents throughput differently. Its tile reads “2,800+ req/s” for Rust and shows a dash in Bifrost’s cell. LiteLLM’s rps_per_dollar.csv records 2,744 requests per second for Bifrost against 2,814 for Rust. The blank cell hides a gap of 2.5% or less: 2.5% in that file, 0.1% in the sweep.
Total p99 at the same load, from two files
The throughput files also expose how unstable single-run tail latency is. At concurrency 64, Bifrost’s total p99 is 52.7 ms in the sweep and 32.2 ms in rps_per_dollar.csv. Rust’s is 64.3 ms in the sweep and 26.9 ms in rps_per_dollar.csv. The ranking flips between LiteLLM’s own files. The blog acknowledges the single-run limitation; the homepage tiles do not repeat that caveat.
The homepage also footnotes its figures with “single client”. That footnote is misleading, because the sweep runs concurrency 1 to 64 and the throughput point uses ceiling_concurrency = 64, so it is not one connection at a time.
The LiteLLM Python proxy in the same sweep
The LiteLLM Python proxy, which still serves Chat Completions and Messages on main:latest, adds far more latency than either compiled gateway in the sweep. As of November 1, 2026, it adds +9.79, +26.95, +251.34 and +546.04 ms of p99 at concurrency 1, 4, 16 and 64, and reaches 179.8 requests per second at 64.
The Python figures put the gaps between the compiled gateways in proportion. At concurrency 64, the Python proxy adds 546 ms, about 13.6x the Rust port, and reaches 180 requests per second, 6% of direct. Its throughput moves from 158.4 requests per second at concurrency 16 to 179.8 at 64, while the direct baseline moves from 735.6 to 2,855.7.
Read as a whole, the sweep shows LiteLLM Rust catching up to where Bifrost already was, not Rust beating Bifrost.
There is a caveat for current LiteLLM users. The LiteLLM Rust gateway documentation warns that the Python proxy on main:latest uses Rust only for /ocr across providers and /audio/transcriptions for Bedrock. Other routes, including Chat Completions and Messages, run on Python, and the per-model rust: true flag currently has no effect. The benchmark measured a narrower Rust beta, which the blog describes as “an early beta, streaming and the full feature surface are still landing”. Teams running LiteLLM today should expect the Python column, not the Rust column, on their chat traffic.
Single runs, error bars and benchmark noise
LiteLLM’s benchmark publishes one measurement per cell with no error bars, a limit its blog states openly. With single runs, sub-millisecond gaps such as the 0.02 ms tie at concurrency 4 or the 0.56 ms gap at 16 cannot be distinguished from run-to-run variation. Only differences that survive repeated trials can be ranked.
LiteLLM is candid about this in the blog. It calls the results “a vendor-run benchmark”, says the runs are single-host and per-scenario without repeated-trial error bars, and tells readers to “treat them as order-of-magnitude differences”. The problem is that the homepage tiles drop those caveats while keeping the multipliers.
The statistical point is general. A percentile is an order statistic from a sample, and the p99 in particular depends on the slowest handful of requests in a run. Two runs of the same gateway on the same machine can produce different p99 values, which is exactly what the two LiteLLM files show for concurrency 64. The Frontier Wire’s analysis of how small benchmarks turn leaderboard gaps into statistical noise makes the same argument for model evaluations: without repeated trials and a published interval, a small gap is not evidence of a ranking.
Three further disclosures are missing:
- Hardware. No machine type, core count or worker count is stated for the benchmark runs of any gateway. The “4 vCPU / 16 GB” in LiteLLM’s materials appears only in the cost model.
- The overhead run’s conditions. No mock latency or concurrency level is given for the overhead panel that produced the 4.54 ms figure.
- Links to the data. The homepage’s “See the benchmark” link goes to an in-page anchor, not to the raw data or a methodology document.
A benchmark that publishes its raw files, as LiteLLM’s does, is more checkable than most. The checking is what surfaces the disagreement between the sweep and the headline.
Configuration differences behind the numbers
The two gateways did not do the same work in the benchmark. LiteLLM’s blog says every gateway ran “with no logging callbacks, spend tracking, or persistence enabled”. The published Bifrost configuration appears to leave logging on, an inference from v2.4.0 code that is not yet confirmed on v1.6.4. The Frontier Wire’s analysis of logging on vs logging off in LiteLLM’s benchmark covers that gap in full.
The benchmark’s Bifrost configuration points at the shared mock upstream, sets config_store: enabled: false and no plugins, and never sets logs_store or enable_logging. In the code, enable_logging defaults to true when unset, a missing logs_store creates a default SQLite log store, and the built-in logging plugin is not switched off by “no plugins”. The current logging documentation states that the logging plugin is automatically enabled in gateway mode with SQLite storage by default, and lists enable_logging as the master toggle and disable_content_logging as the switch for request and response bodies.
In v1.6.4, the log store’s SQLite setup opens a disk-backed logs.db at startup, and the log writer’s configuration flushes at 1,000 entries, 5 seconds from the first entry, or 300 MiB of estimated payload. As a result, the Bifrost results include log buffering and SQLite writes, and a controlled rerun is needed to measure their contribution. No number has been put on that contribution.
Two other version details bear on the latency comparison:
- Versions. The benchmark pits a Rust beta without streaming against Bifrost v1.6.4. The project’s changelogs list v1.6.5 to v1.6.11, then v2.0.0 to v2.4.0, since that build. The homepage does not show that version. The Frontier Wire’s piece on benchmarking a Rust beta against an old Bifrost build examines that mismatch.
- Route. Bifrost was called on its native /anthropic/v1/messages route, because the benchmark’s README says v1.6.4 does not mount that integration at /v1/messages.
None of this changes the sweep’s numbers. It changes what they describe: a build that predates the v2.x line, doing logging work the blog says was disabled, against a Rust beta doing forwarding only.
Where LiteLLM’s Rust gateway leads
LiteLLM’s Rust gateway does lead on several measures in its own files. Rust has the lower added p99 at concurrency 16, records lower CPU and memory in every file, and is ahead at concurrency 256 in an exploratory single run that was excluded from the sweep.
The concurrency 256 JSON files record:
| Metric at c=256 | Direct | LiteLLM Rust | Bifrost | LiteLLM Python |
|---|---|---|---|---|
| p50 | 48.1 ms | 55.5 ms | 89.3 ms | 1,513 ms |
| p99 | 434.8 ms | 2,667.8 ms | 5,421.3 ms | 10,733.6 ms |
Source: c256 JSON files in the ai-gateway-bench results directory, as of November 1, 2026.
Rust is about 1.6x better than Bifrost at p50 and about 2.0x better at p99 at this level. It carries a clear caveat: one run of 5,000 requests per gateway, no errors and no RPS field, with the direct baseline already outside the benchmark’s own threshold. It is an exploratory result, not a reliable capacity comparison.
On resources, the CPU files show a mean of 0.66% for Rust against 2.59% for Bifrost, with peaks of 15.9% and 79.5%. On memory, Rust is smaller in every file. Those are the subject of separate claims on the homepage and are outside the scope of this latency piece, but they belong in any fair reading of the benchmark; The Frontier Wire’s overview of the LiteLLM Rust benchmark covers the memory and cost claims alongside latency. Taken together with the concurrency 16 row, they show a Rust gateway that is competitive, and in some measures ahead, without supporting the specific 7x overhead multiplier.
What the latency figures mean for engineers
For a team choosing a gateway, the sweep says the two compiled gateways add similar, small p99 latency up to concurrency 16 and diverge at 64, where Bifrost is lower. The headline multipliers do not describe any measured load level. The useful question is what each gateway adds at the concurrency a team actually runs.
Several practical rules follow from the files:
- Ask for the concurrency behind every overhead figure. An added-p99 number without its load level cannot be compared with anything. The sweep shows the same gateway’s overhead moving from under a millisecond to tens of milliseconds as concurrency rises.
- Read absolute and relative gaps together. Rust’s lead at concurrency 16 is 2.7x in relative terms and 0.56 ms in absolute terms. Bifrost’s lead at 64 is about 29% in relative terms and comes on top of a direct p99 of 24.02 ms. A multiplier on a tiny base can be large and still irrelevant to a request that takes 22 ms before any gateway touches it.
- Match configurations before comparing. A gateway with logging on is doing more work than one with logging off. Teams that need request logs in production should benchmark both gateways with logging on, because that is the configuration they will run.
- Benchmark the version you will deploy. The LiteLLM benchmark tested a Rust beta against a v1.6.4 build of the other gateway, and LiteLLM’s own documentation says chat routes on main:latest still run on Python.
- Repeat runs and publish intervals. Single-run p99 values flipped ranking between two files in the same repo.
The Frontier Wire’s comparison of LiteLLM alternatives sets out a week-long test plan along these lines, built on mirrored production traffic and p99 rather than averages. Its broader survey of AI gateways and the explainer on running an AI gateway in front of every model call cover what else a gateway adds beyond latency.
Readers who want the vendor perspective can compare the vendor’s own feature-by-feature comparison of the two gateways and its write-up on high-throughput workloads, with the same caution this piece applies to LiteLLM’s figures.
For teams already moving off the Python proxy, the same publisher has a migration resource for LiteLLM users, a longer step-by-step migration guide and a builder’s guide to LLM gateways.
Bifrost is an open-source AI gateway written in Go; its product page and source repository are the places to check current versions and configuration defaults.
A planned Part 2 follow-up will run both gateways with logging off and again with logging on, on a current build, with repeated trials, error bars, and published hardware, worker counts, mock latency and concurrency for every run. That is the test that would settle the question. Until then, the honest summary of LiteLLM vs Bifrost latency in LiteLLM’s own data is a close race with the lead changing by load level, and a 7x headline that the sweep does not support as stated.
Source: Debunking LiteLLM Rust Benchmarking: Part 1, by Akshay Deo of Maxim AI, which builds the Bifrost gateway.
Sources
- Debunking LiteLLM Rust Benchmarking: Part 1 (Akshay Deo, Maxim AI, November 1, 2026)
- LiteLLM homepage, benchmark section
- LiteLLM blog: Rust AI gateway benchmarks
- ai-gateway-bench: latency_vs_concurrency.csv
- ai-gateway-bench: overhead_comparison.csv
- ai-gateway-bench: rps_per_dollar.csv
- ai-gateway-bench: results directory
- ai-gateway-bench: Bifrost gateway configuration and README
- LiteLLM docs: Rust gateway
- Bifrost docs: built-in observability and logging
Questions readers ask
How much latency does LiteLLM Rust add compared to Bifrost?
It depends on concurrency. In the latency_vs_concurrency.csv file in LiteLLM's ai-gateway-bench repo, as of November 1, 2026, LiteLLM Rust adds +0.89, +0.61, +0.33 and +40.28 ms of p99 latency at concurrency 1, 4, 16 and 64. Bifrost adds +0.75, +0.63, +0.89 and +28.68 ms. Bifrost is lower at 1 and 64, Rust is lower at 16, and the 0.02 ms gap at 4 is noise.
Is LiteLLM's Rust gateway really 7x faster than Bifrost?
The claim is not reproducible from LiteLLM's published sweep. The roughly 7x figure compares 4.54 ms for Bifrost with 0.66 ms for Rust, both taken from overhead_comparison.csv, which states no concurrency level. No row of the concurrency sweep is near 4.54 ms for Bifrost, and in that sweep Bifrost adds less p99 latency than Rust at concurrency 1 and 64.
What is p99 latency?
p99 latency is the 99th percentile of response times: 99% of requests finished at or below that value and 1% took longer. It describes the slow tail rather than the typical request, which is why it is the usual measure for latency-sensitive services. A p99 of 22 ms means one request in a hundred took more than 22 ms.
What does added p99 latency over direct mean?
It is the p99 latency measured through a gateway minus the p99 latency of the same requests sent straight to the upstream. LiteLLM's benchmark blog defines overhead as gateway latency minus direct-to-mock latency and charts it as p99 added latency. Because both runs hit the same mock upstream, the difference estimates what the gateway contributes to the slowest requests.
Which gateway does LiteLLM's 3.5x overhead claim compare against?
A different gateway, not Bifrost. LiteLLM's homepage says its Rust gateway adds 0.66 ms at p99, 3.5x lower overhead than the next AI gateway. The next gateway on that chart is a different gateway at 2.29 ms, and 2.29 divided by 0.66 is 3.5. The blog's roughly 7x figure is a separate comparison against Bifrost's 4.54 ms.
How much latency does the LiteLLM Python proxy add?
In the same sweep, as of November 1, 2026, the LiteLLM Python proxy adds +9.79, +26.95, +251.34 and +546.04 ms of p99 latency at concurrency 1, 4, 16 and 64. At concurrency 64 it reaches 179.8 requests per second against a direct baseline of 2,855.7, about 6% of direct.