
Agent benchmarks are now 44% of new AI benchmarks, and most are too small to rank close models
An analysis of 352 sized benchmarks in The Frontier Wire's AI benchmarks dataset finds agent benchmarks are about 4.5 times smaller than the rest. That makes many leaderboard gaps statistical noise. The data, the method, and a table of the smallest score gap worth taking seriously at each benchmark size.
Agent benchmarks, the tests that ask an AI system to use tools, operate a computer, fix code or run an experiment, made up 44% of the new benchmarks in The Frontier Wire’s AI benchmarks dataset in 2026, up from 18% in 2023. They are also small. The median agent benchmark with a stated size has 200.5 tasks, against 914 for every other kind of benchmark, a ratio of about 4.5 to 1. At 200 tasks, a model scoring near 50% carries a 95% margin of error of about 6.9 percentage points either way, before any other source of noise is counted. A leaderboard gap of two or three points on most agent benchmarks says very little about which model is better.
TL;DR
- Agent benchmarks rose from 6 of 33 new benchmarks in the dataset in 2023 (18%) to 45 of 102 in January to October 2026 (44%).
- The median agent benchmark has 200.5 tasks; the median other benchmark has 914. Cybersecurity (median 50 tasks) and AI research agents (61.5) are the smallest areas.
- At the median agent size, a score near 50% has a margin of about ±6.9 points; at the median other size, about ±3.2. 63.4% of sized agent benchmarks are below the 385 tasks needed to get the margin under ±5 points.
- Two models on a 200-task benchmark need a gap of about 9.8 points to be distinguishable when scored independently. Paired comparisons on the same tasks, repeated runs and published confidence intervals shrink that, and most leaderboards report none of them.
The finding in numbers
This analysis covers the 481 benchmarks in the dataset, of which 352 state a usable size (a count of tasks or questions of 5 or more). It classes a benchmark as an agent benchmark when its task area is one of seven: agents and tool use, computer use and web, deep research agents, AI research agents, economic tasks, software engineering, or cybersecurity. Those seven areas hold 148 of the 481 rows; 112 of them have a stated size.
| Measure | Agent benchmarks | Other benchmarks | All |
|---|---|---|---|
| Benchmarks with a stated size | 112 | 240 | 352 |
| Median tasks per benchmark | 200.5 | 914 | 490 |
| 95% margin at the median, score near 50% | ±6.9 points | ±3.2 points | |
| Share under 385 tasks (margin above ±5 points) | 63.4% (71) | 37.9% (91) | 46.0% (162) |
| Share under 100 tasks | 29.5% (33) | 25.4% (61) | |
| Share at 2,401 tasks or more (margin ±2 points or less) | 8.9% (10) | 33.8% (81) |
The two groups differ most at the top of the size range. A third of non-agent benchmarks are large enough to pin a single score to within two points; fewer than one agent benchmark in ten is. The share under 100 tasks is similar in both groups, but the agent group has few of the very large question banks that pull the other median up.
Every figure can be reproduced from the CSV download using the method section below.
Agent benchmarks are taking over
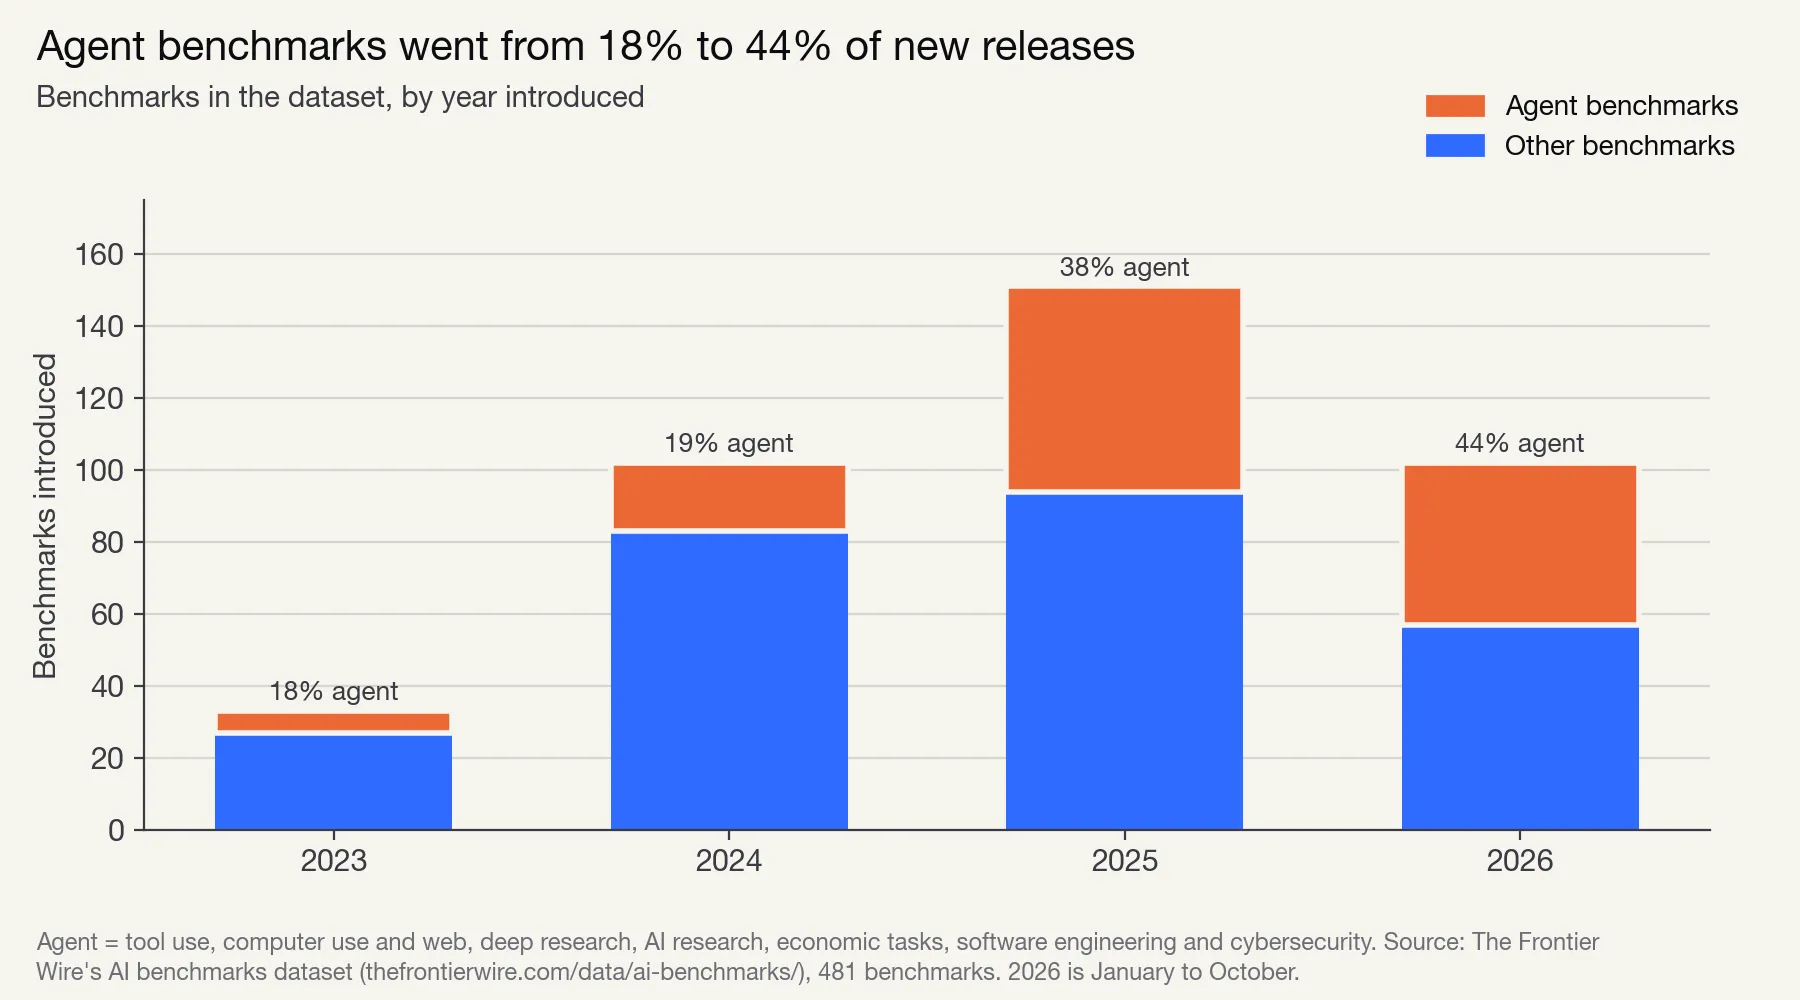 Figure 1: Agent benchmarks rose from 18% of new benchmarks in the dataset in 2023 to 44% in 2026 (January to October).
The year counts below are the benchmarks in the dataset with a known year of introduction (399 of 481). Before 2023 the dataset holds only a handful of canonical benchmarks, all non-agent, because its coverage of newer benchmarks starts with papers published in January 2023.
| Year introduced | Agent | Other | Total | Agent share |
|---|---|---|---|---|
| 2019 to 2022 | 0 | 11 | 11 | 0% |
| 2023 | 6 | 27 | 33 | 18% |
| 2024 | 19 | 83 | 102 | 19% |
| 2025 | 57 | 94 | 151 | 38% |
| 2026 (January to October) | 45 | 57 | 102 | 44% |
The jump between 2024 and 2025 is the one that matters. In 2024 roughly one new benchmark in five tested agents; in 2025 it was closer to two in five. The shift is visible in how models are compared: The Frontier Wire’s ranking of current AI models draws many of its headline numbers from agent suites such as Terminal-Bench and OSWorld rather than from exam-style question sets.
The same period saw benchmarks of every kind get smaller. Across all sized benchmarks, the median size by year of introduction fell from 1,000 tasks in 2024 (74 benchmarks) to 405 in 2025 (111) and 300 in 2026 (77). Part of that fall is the agent share rising, but both groups shrank on their own: the agent median went from 300 tasks in 2024 (16 benchmarks) to 201.5 in 2025 (44) and 142 in 2026 (36), and the non-agent median from 2,312.5 (58) to 1,000 (67) and 950 (41).
| Year introduced | Benchmarks with a stated size | Median tasks |
|---|---|---|
| 2023 | 29 | 466 |
| 2024 | 74 | 1,000 |
| 2025 | 111 | 405 |
| 2026 (January to October) | 77 | 300 |
Where the small benchmarks are
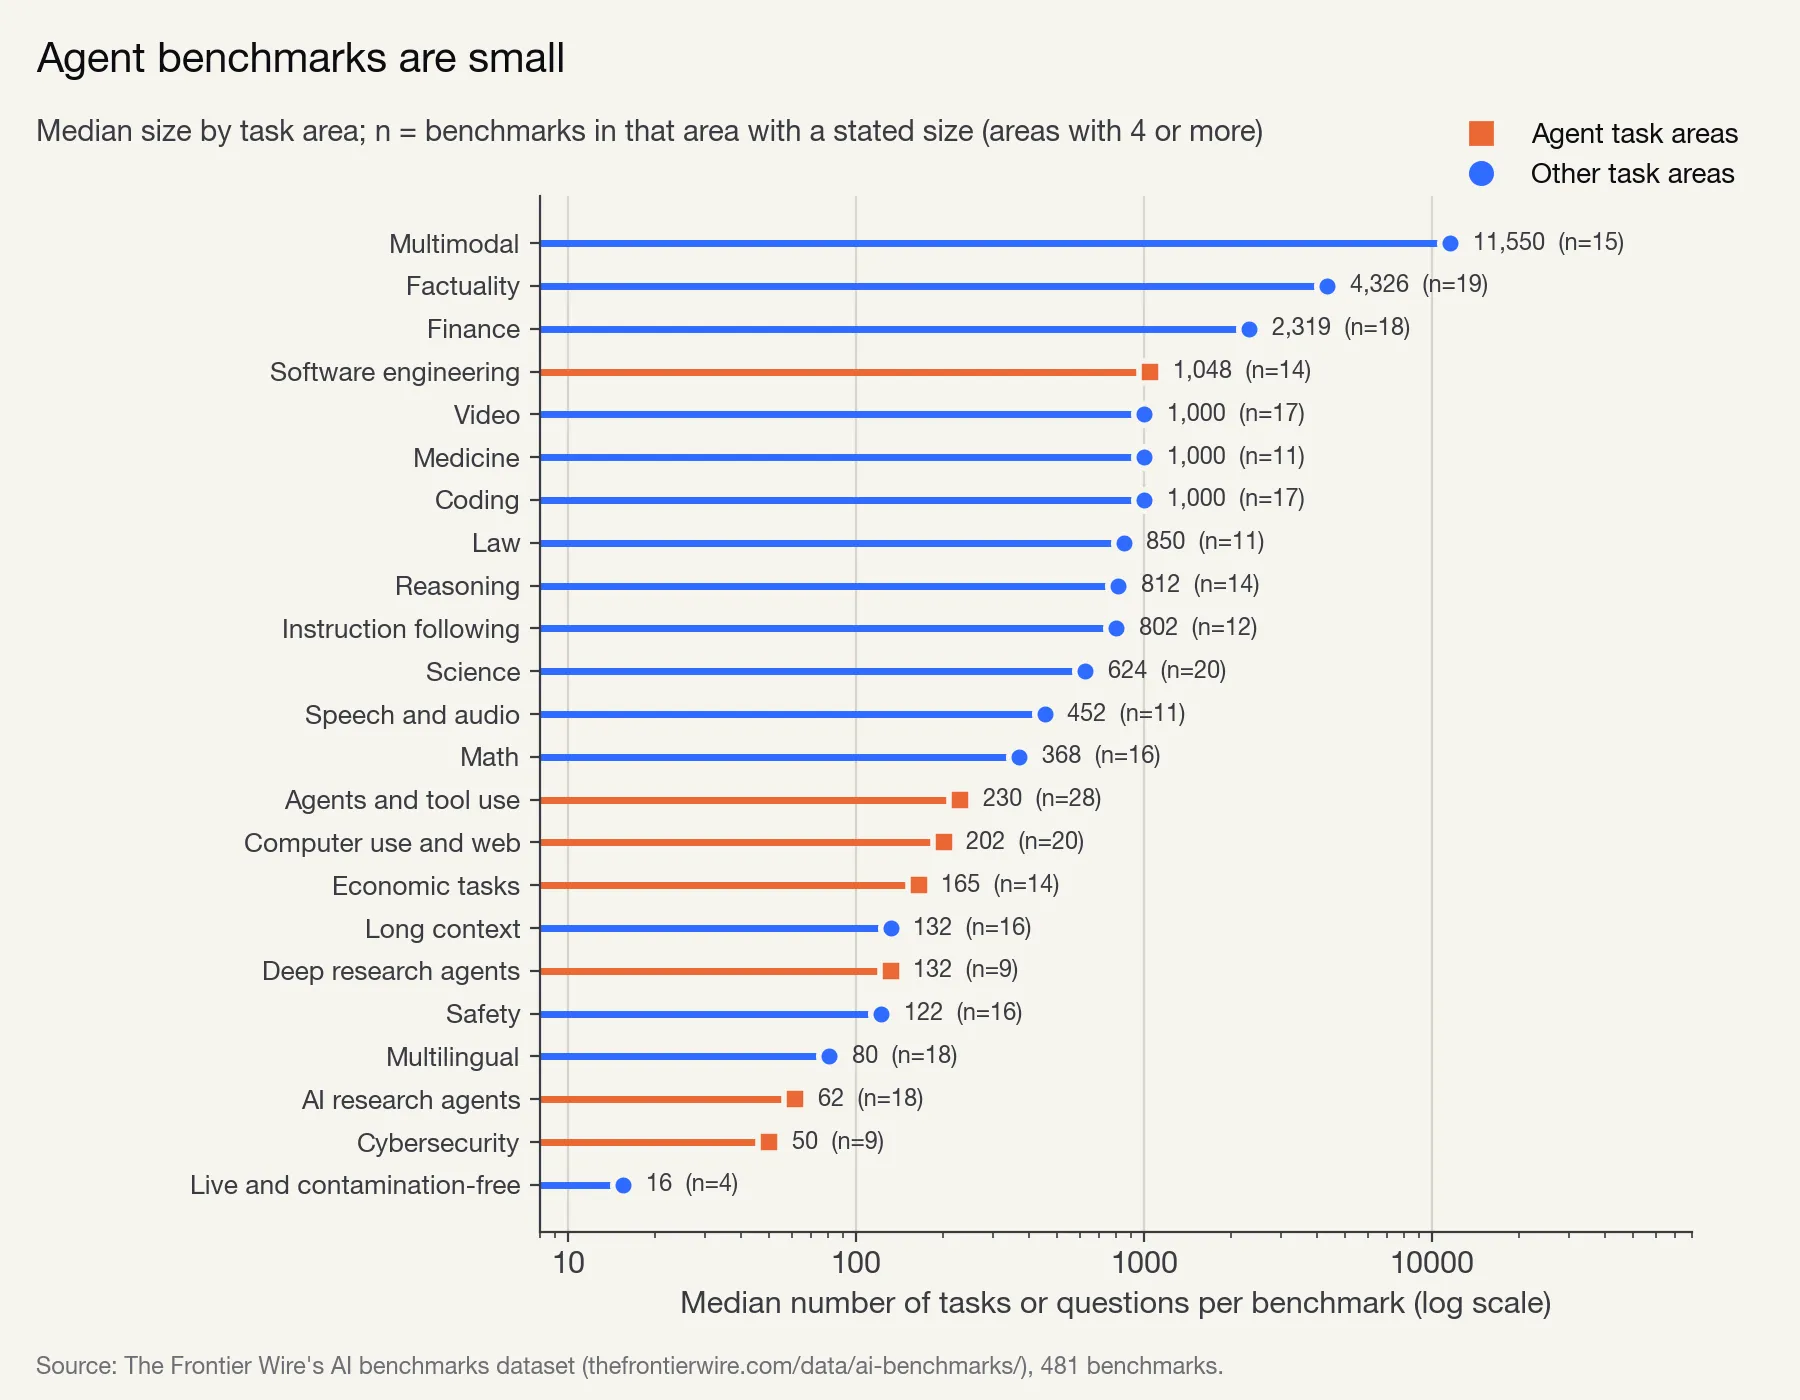 Figure 2: Median number of tasks per benchmark by task area (log scale). Agent task areas are marked separately; most sit at the small end.
Agent areas sit at the bottom of the size ranking with two exceptions. Software engineering is large because SWE-bench and its descendants draw their tasks from real GitHub issues and pull requests, which exist in volume. Economic tasks sits in the middle. Several non-agent areas are small too: the median multilingual, safety and long-context benchmark has fewer than 135 items.
| Task area | Agent area | Benchmarks with a stated size | Median tasks |
|---|---|---|---|
| Live and contamination-free | No | 4 | 15.5 |
| Cybersecurity | Yes | 9 | 50 |
| AI research agents | Yes | 18 | 61.5 |
| Multilingual | No | 18 | 80.5 |
| Safety | No | 16 | 122 |
| Deep research agents | Yes | 9 | 132 |
| Long context | No | 16 | 132 |
| Economic tasks | Yes | 14 | 165 |
| Computer use and web | Yes | 20 | 201.5 |
| Agents and tool use | Yes | 28 | 230 |
| Math | No | 16 | 368.5 |
| Speech and audio | No | 11 | 452 |
| Science | No | 20 | 624 |
| Instruction following | No | 12 | 802 |
| Reasoning | No | 14 | 811.5 |
| Law | No | 11 | 850 |
| Coding | No | 17 | 1,000 |
| Medicine | No | 11 | 1,000 |
| Video | No | 17 | 1,000 |
| Software engineering | Yes | 14 | 1,047.5 |
| Finance | No | 18 | 2,319 |
| Factuality | No | 19 | 4,326 |
| Multimodal | No | 15 | 11,550 |
Some of the benchmarks behind those medians are household names in model launch posts. Their sizes, checked against the papers that introduced them:
- SWE-bench: 2,294 problems drawn from real GitHub issues across 12 Python repositories. Its widely reported subset, SWE-bench Verified, has 500 human-validated tasks according to the dataset entry, which links OpenAI’s announcement.
- OSWorld: 369 computer tasks in real desktop and web applications.
- Terminal-Bench 2.0: 89 tasks in command-line environments.
- MLE-bench: 75 Kaggle competitions used as machine learning engineering tasks.
- CTFTiny: 50 capture-the-flag challenges, designed as a lightweight benchmark for quick evaluation.
- Cybench: 40 professional-level capture-the-flag tasks from four competitions.
- RE-Bench: 7 open-ended research engineering environments, scored against 71 eight-hour attempts by 61 human experts.
For comparison, GAIA has 466 questions, WebArena 812 tasks, BrowseComp 1,266 questions and GPQA 448 multiple-choice questions. Even tau-bench, a frequently cited tool-use benchmark whose size field is blank in the dataset, splits into 115 retail tasks and 50 airline tasks in its paper, so a per-domain score rests on 115 or 50 tasks.
Why agent tasks are expensive
The size gap is not carelessness. An exam-style question is a string and an answer key. An agent task is a small software project: a starting environment, a goal, and an automatic way to check whether the environment ended in the right state.
OSWorld’s paper describes the cost plainly. Nine computer science students spent over three months, approximately 1,800 hours in total, building and double-checking its tasks, each with an initial-state configuration and a custom evaluation script. That is roughly five hours of skilled labour per task. tau-bench needed simulated databases of users, orders, products, flights and reservations, plus written domain policies, before a single task could be scored. RE-Bench’s seven environments were calibrated against 71 eight-hour human attempts. Cybench’s hardest task took human teams 24 hours and 54 minutes in the original competition.
Running the tasks is expensive too. Each attempt is a multi-step episode in a live environment rather than a single model call, so evaluating many models on a large suite several times over multiplies the cost. Some authors publish deliberately reduced suites for cheap iteration, which is the stated purpose of CTFTiny. The economics push toward fewer, richer tasks, and fewer tasks means wider error bars.
The Frontier Wire’s guide to comparing LLM evaluation frameworks covers the tooling side; the statistics below apply whatever tool runs the evaluation.
How much noise a benchmark size implies
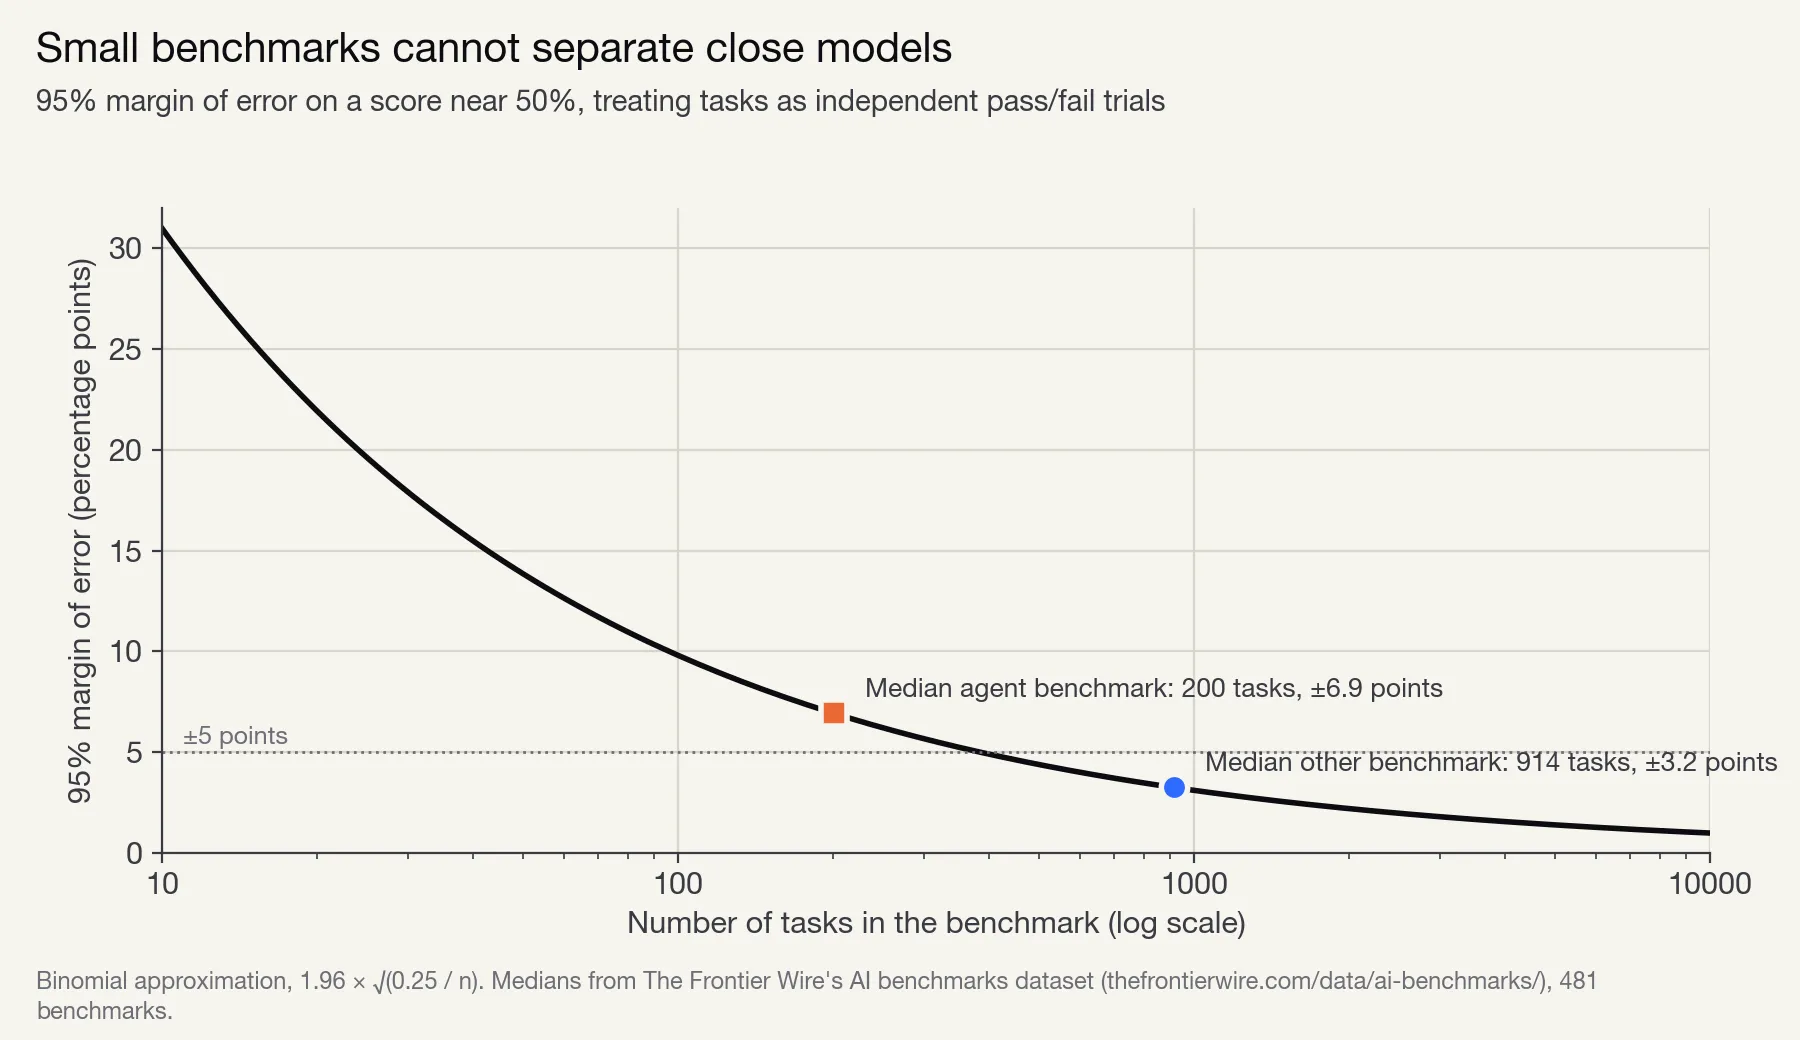 Figure 3: 95% margin of error on a score near 50%, treating each task as an independent pass/fail trial. The median agent benchmark is above the ±5 point line; the median other benchmark is below it.
A benchmark score is an average over a sample of tasks. If the benchmark were rebuilt from a fresh draw of similar tasks, the same model would score somewhat differently. The margin of error describes that spread. For a pass/fail benchmark with n independent tasks and a true success rate p, the 95% margin is 1.96 × √(p(1 − p) / n). At p = 0.5, the worst case, that becomes 1.96 × √(0.25 / n), which is the curve in Figure 3.
Evan Miller’s Adding Error Bars to Evals, written at Anthropic, frames the same point in general terms: an evaluation is an experiment whose questions are drawn from an unseen super-population, and its result should be reported with a standard error. Its first recommendation is to compute that standard error with the Central Limit Theorem, which for a pass/fail score reduces to the binomial formula above.
What matters for leaderboards is the gap between two models, not one score. Two scores near 50%, each measured independently on n tasks, need to differ by about 1.96 × √(0.5 / n) before the difference is significant at the 95% level. That is √2, about 1.41, times the single-score margin. The table converts both into points and into tasks.
| Benchmark size (tasks) | Example from the dataset | Margin on one score (±points) | Minimum gap between two independent scores (points) | Same gap in tasks |
|---|---|---|---|---|
| 50 | CTFTiny; tau-bench airline | 13.9 | 19.6 | 10 |
| 75 | MLE-bench | 11.3 | 16.0 | 12 |
| 89 | Terminal-Bench 2.0 | 10.4 | 14.7 | 13 |
| 200 | Median agent benchmark | 6.9 | 9.8 | 20 |
| 369 | OSWorld | 5.1 | 7.2 | 27 |
| 500 | SWE-bench Verified | 4.4 | 6.2 | 31 |
| 914 | Median other benchmark | 3.2 | 4.6 | 42 |
| 1,266 | BrowseComp | 2.8 | 3.9 | 49 |
| 2,294 | SWE-bench | 2.0 | 2.9 | 66 |
| 10,000 | Large question bank | 1.0 | 1.4 | 139 |
Read across a row: on an 89-task terminal benchmark, one model would need to solve about 13 more tasks than another, a gap of nearly 15 points, before an unpaired comparison could call it real. On a 500-task coding benchmark, a gap of about 6 points is the threshold.
Two caveats make the table conservative in one direction and optimistic in the other. Scores far from 50% have narrower margins, because p(1 − p) shrinks: at a score of 90% the margin is 60% of the 50% value. And paired comparisons on identical tasks narrow the threshold, as the next section explains. Against that, the table assumes the only noise is which tasks happened to be chosen. Agent runs add more.
Noise that task counts do not capture
Three further sources of noise make agent scores less certain than the binomial formula suggests.
Run-to-run variation. Agents sample their actions, so the same model on the same task can succeed once and fail the next time. The tau-bench authors measured this directly. They define pass^k as the chance that all k independent trials of a task succeed, averaged across tasks. gpt-4o with function calling scored a pass^1 of about 61% on the retail domain, but its pass^8 fell to about 25%: on most tasks it sometimes succeeded, but on few did it succeed every time. A single run per task mixes that variation into the score.
pass@k inflation. The mirror image, pass@k, counts a task as solved if any one of k attempts succeeds. It was popularised by the HumanEval paper, where Codex solved 28.8% of problems with one sample and 70.2% with 100 samples per problem. pass@k is a legitimate measure of what search over many attempts can find, but a pass@k number and a pass@1 number on the same benchmark are not comparable, and a leaderboard that mixes them is ranking different quantities.
Clustered tasks. The binomial formula assumes tasks are independent. Many agent benchmarks are built from a few sources: SWE-bench’s 2,294 problems come from 12 repositories, and Cybench’s 40 tasks from 4 competitions. Tasks from the same source tend to succeed or fail together. Miller’s paper shows that on DROP, a reading benchmark with questions grouped by passage, clustered standard errors can be over 3X larger than naive ones; the ratio was 1.10 on RACE-H and 1.88 on MGSM. No published figure exists for the agent benchmarks in this dataset, but their structure suggests the effective number of independent tasks is lower than the headline count.
Scaffolding adds a fourth, non-statistical layer. The same model can score very differently under different agent harnesses, tool sets and time limits; Cybench, for example, evaluated its two strongest models across four agent scaffolds. A leaderboard that compares a model in one harness to a model in another is not comparing models alone. The Frontier Wire’s comparison of Codex and Claude Code shows how much the harness around a model shapes what it can do.
What good practice looks like
None of this makes small benchmarks useless. A 50-task benchmark of hard, realistic offensive-security challenges says more about real capability than 10,000 trivia questions. The problem is reading small differences as rankings. Miller’s paper lists five recommendations, and each one addresses part of the problem.
- Report a standard error or confidence interval with every score. The table above gives the binomial version; Miller’s section 2 gives the formulas for independent and clustered questions.
- Use clustered standard errors when tasks share a source. For agent benchmarks the natural cluster is the repository, environment, website or competition a task came from (section 2.2).
- Run each task more than once and average. Miller’s resampling section works through an example in which two samples per question cut the variance of the estimate by one third and six samples cut it by five ninths. The same section advises against lowering sampling temperature to make results look stable (section 3.3), since that measures a different model configuration. For agents, reporting pass^k alongside pass^1 shows how much of a score is consistent.
- Compare models on the same tasks with paired differences. When two models agree on which tasks are easy and which are hard, the variance of their score difference drops. Miller calls paired differences a free reduction in estimator variance and recommends that technical reports include pairwise differences, pairwise standard errors and score correlations. In his worked example, with a correlation of 0.5, pairing cuts the variance of the difference by one third. Under the binomial assumptions used here, a per-task correlation of 0.5 brings the threshold for a significant gap down from √2 times the single-score margin to the single-score margin itself: about 6.9 points instead of 9.8 at 200 tasks.
- Do a power analysis before running the evaluation. Miller’s section 5 gives the sample-size formula. Inverting the simple binomial version: a ±5 point margin needs 385 tasks, ±3 points needs 1,068 and ±2 points needs 2,401. A team that wants to detect a two-point improvement from a new prompt or model on a 200-task agent suite will not be able to, however many times it reruns the comparison with one sample per task.
For readers rather than evaluators, the practical rule is simpler. Find the benchmark’s size, look up the row in the gap table, and treat any lead smaller than that threshold as a tie unless the publisher reports a paired comparison or a confidence interval that says otherwise. The same discipline applies to production monitoring: an agent success rate computed from 150 traces in a day has the same error bars as a 150-task benchmark, a point covered in The Frontier Wire’s review of agent observability tools. Gains claimed for extra inference effort, the subject of Test-time compute, explained, deserve the same test.
Method
Data. All counts come from the published AI benchmarks dataset (CSV), 481 rows with columns for name, task area, what the benchmark measures, size, year and paper link. The dataset was compiled in October 2026 from papers published since January 2023 across 24 task areas, plus 34 widely cited earlier benchmarks. See the dataset’s headline figures and its methodology note for details.
Size. The size column is free text taken from each paper (for example “466 questions (with 300 answers retained for leaderboard)” for GAIA). This analysis parsed size as the first stated count of tasks or questions in that field, with thousands separators removed. Values under 5 were excluded. 352 of the 481 rows yield a size; the other 129 have an empty field or no count of 5 or more. A spot check of 20 parsed sizes against the papers found 18 matched the paper’s task count. The kind of error the parse can make is visible in the MMLU row, whose size field reads “57 tasks”: that is the number of subjects, not questions. Errors of this kind can push a benchmark in either direction, and the medians are less sensitive to them than means would be.
Agent classification. A row counts as an agent benchmark if its task area is agents and tool use, computer use and web, deep research agents, AI research agents, economic tasks, software engineering or cybersecurity: 148 rows. This is broader than the dataset page’s agent benchmark count of 101, which covers only the first four areas. Software engineering, economic tasks and cybersecurity are included here because their benchmarks are predominantly multi-step tasks in which a model acts in an environment (resolving repository issues, completing office workflows, capturing flags). Coding is not, because its rows are mostly code-generation benchmarks such as HumanEval, although it includes a few repository-level ones; counting coding as agent would move the agent median only from 200.5 to 214 tasks.
Statistics.
- Medians are ordinary medians of the parsed sizes; with an even count, the mean of the two middle values (hence 200.5 and 61.5).
- The 95% margin of error for a score near 50% is 1.96 × √(0.25 / n), in percentage points when multiplied by 100. At n = 200.5 this gives 6.92; at n = 914, 3.24.
- The minimum significant gap between two independently measured scores near 50% is 1.96 × √(0.5 / n).
- The size at which the margin first reaches ±5 points or less is the smallest n with 1.96 × √(0.25 / n) ≤ 0.05, which is 385 (from n ≥ (1.96 × 0.5 / 0.05)², or 384.16). The same formula with 0.03, 0.02 and 0.01 gives 1,068, 2,401 and 9,604.
- Year shares are agent rows divided by all rows with a known year in that year. Year medians use all sized rows with a known year.
Reproducing it. Download the CSV, parse the first integer from the size column (stripping commas), drop values under 5, flag rows in the seven agent areas, and take medians by flag, task area and year. The charts were drawn from these computed values.
What the data cannot show
The dataset is a sample, not a census. It covers papers published since 2023 across 24 task areas, with a similar number of papers collected for each area, plus 34 canonical benchmarks. The count of benchmarks per year reflects what that collection found, so the rising agent share is a statement about this sample. It is consistent with the visible shift in how models are marketed, but a different collection would give different counts. The 2026 figures cover January to October only.
Classification is by task area, not by inspection. Each benchmark sits in the task area of the search that found it, even if it fits more than one. A tool-use benchmark found by the long-context search counts as long context here. The agent group is therefore approximate at the edges.
Sizes are parsed, not hand-verified. Two of 20 spot-checked sizes did not match the paper. Some size fields describe tasks, some questions, some samples or rubric items (PaperBench’s 8,316 “tasks” are individually gradable rubric items spread across 20 papers). Many benchmarks also publish a smaller leaderboard split than the full set, as GAIA does, so the size used in practice can be smaller than the size recorded.
The margin formula is a floor, not a full error model. It assumes independent pass/fail tasks and a score near 50%. Scores near 0% or 100% have narrower margins. Clustered tasks, run-to-run variation, judge models that grade open-ended answers, and harness differences all widen the real uncertainty, and none of them are measured here. Benchmarks scored on a continuous scale, such as RE-Bench’s scores against reference solutions or PaperBench’s rubric-based replication scores, have error bars that depend on the score distribution rather than on a binomial count.
Size is not quality. A small benchmark of carefully built, contamination-free tasks can be more informative about capability than a large scraped one, and a large benchmark can be saturated or leaked into training data. This analysis measures only how precisely a score can be estimated, not whether the benchmark measures the right thing. The Frontier Wire’s guide to reading a model card like an auditor covers the questions to ask about the second problem.
What the numbers mean for leaderboards
The AI field is moving its scoreboard from exam questions to agent tasks, and that move is overdue: the work people want from models is increasingly multi-step work in real software environments. But the new scoreboard is built from small samples. Nearly two thirds of the sized agent benchmarks in this dataset have fewer tasks than it takes to pin a single score to within five points, and the typical one needs a gap of about ten points before two independently scored models can be told apart.
The fix is cheap next to the cost of building the benchmarks: report a confidence interval with every agent score, run each task more than once, show pass^k alongside pass^1, compare models on identical tasks with paired standard errors, and publish per-task results so others can check. Until that becomes standard, the most useful thing a reader can do with a two-point lead on an 89-task or 369-task leaderboard is look up the benchmark’s size and treat the lead as a tie.
The benchmark data behind this piece is free to download and reuse from the AI benchmarks dataset page. It is one of three original analyses The Frontier Wire published from its datasets this week, alongside an examination of AI water use growth against efficiency gains and a comparison of energy-per-prompt estimates.
Sources
- The Frontier Wire: AI benchmarks directory (dataset)
- Adding Error Bars to Evals: A Statistical Approach to Language Model Evaluations (Evan Miller, Anthropic, 2024)
- tau-bench: A Benchmark for Tool-Agent-User Interaction in Real-World Domains (Yao et al., 2024)
- Evaluating Large Language Models Trained on Code (Chen et al., 2021), HumanEval and pass@k
- SWE-bench: Can Language Models Resolve Real-World GitHub Issues? (Jimenez et al., 2023)
- Introducing SWE-bench Verified (OpenAI, 2024)
- OSWorld: Benchmarking Multimodal Agents for Open-Ended Tasks in Real Computer Environments (Xie et al., 2024)
- MLE-bench: Evaluating Machine Learning Agents on Machine Learning Engineering (Chan et al., 2024)
- Towards Effective Offensive Security LLM Agents, introducing CTFTiny (Shao et al., 2025)
- Cybench: A Framework for Evaluating Cybersecurity Capabilities and Risks of Language Models (Zhang et al., 2024)
- Terminal-Bench: Benchmarking Agents on Hard, Realistic Tasks in Command Line Interfaces (2026)
- RE-Bench: Evaluating frontier AI R&D capabilities of language model agents against human experts (2024)
- PaperBench: Evaluating AI's Ability to Replicate AI Research (2025)
- GAIA: a benchmark for General AI Assistants (Mialon et al., 2023)
- BrowseComp: A Simple Yet Challenging Benchmark for Browsing Agents (Wei et al., 2025)
- WebArena: A Realistic Web Environment for Building Autonomous Agents (Zhou et al., 2023)
- GPQA: A Graduate-Level Google-Proof Q&A Benchmark (Rein et al., 2023)
- Measuring Massive Multitask Language Understanding (Hendrycks et al., 2020)
Questions readers ask
How many tasks does an AI benchmark need for a reliable score?
It depends on the precision needed. Treating tasks as independent pass/fail trials, a score near 50% has a 95% margin of error of about 5 percentage points either way at 385 tasks, about 3 points at 1,068 tasks, about 2 points at 2,401 tasks and about 1 point at 9,604 tasks. Comparing two models needs a larger gap than the single-score margin unless the comparison is paired on the same tasks.
Are agent benchmarks smaller than other LLM benchmarks?
Yes, in The Frontier Wire's dataset. The median agent benchmark with a stated size has 200.5 tasks against 914 for other benchmarks, and 63.4% of sized agent benchmarks have fewer than 385 tasks, compared with 37.9% of the rest. Agent tasks are expensive to build because each needs an environment, a starting state and an automatic checker.
What is the difference between pass@k and pass^k?
pass@k is the chance that at least one of k independent attempts at a task succeeds, so it rises as k grows. pass^k, proposed by the authors of tau-bench, is the chance that all k attempts succeed, so it falls as k grows and measures consistency. In the tau-bench paper, gpt-4o's pass^1 of about 61% on the retail domain fell to about 25% at pass^8.
How should two models be compared on a small benchmark?
Run both models on the same tasks and analyze the per-task differences (a paired comparison), run each task several times and average, report a standard error or confidence interval, and use clustered standard errors when tasks come in related groups. These are the recommendations of Evan Miller's 2024 paper Adding Error Bars to Evals.
Where does the data in this analysis come from?
From The Frontier Wire's AI benchmarks directory, 481 benchmarks compiled in October 2026 from papers across 24 task areas, plus 34 widely cited benchmarks. Each row links the paper that introduced the benchmark. The table can be downloaded as CSV.