
AI water use per kWh fell at six big tech firms, yet total consumption rose at all six
An analysis of company sustainability reports in The Frontier Wire's AI water and energy dataset. Every one of the six companies that publish two years of water and electricity used less water per kilowatt-hour. None used less water. Together they added about 17.7 million cubic meters in a year.
Each of the six large technology companies that publish two consecutive, comparable years of water consumption and electricity data now uses less water for each kilowatt-hour it draws, and each of them uses more water in total. Across Google, Microsoft, Meta, Tencent, Alibaba and Baidu, water consumed per kWh of electricity fell by between 1.3% (Microsoft) and 15.4% (Meta) in the latest reporting year. Total water consumption still rose at all six, by between 1.5% (Meta) and 33.6% (Google), because electricity use grew by 7% to 38%. Google alone added 10.4 million cubic meters of consumption in 2025. The six together added about 17.7 million m³. The efficiency is real. It is being outrun by growth.
TL;DR
- Water per kWh fell at all six companies with comparable data; total water consumption rose at all six.
- Electricity use grew 7% to 38% year on year, faster than water at every company, so efficiency slowed the rise in water use without reversing it.
- The six added about 17.7 million m³ of water consumption in one year; Google accounted for 10.4 million m³ of that.
- Water per kWh ranges 11-fold, from 0.17 L/kWh at Meta to 1.88 L/kWh at Alibaba, mostly because of scope, cooling design and what each company counts as water.
- On-site cooling is the smaller part of the picture: Berkeley Lab puts US data centers’ 2023 direct water at 66 billion litres against nearly 800 billion litres used to generate their electricity.
This analysis is built on The Frontier Wire’s AI water and energy use dataset, which compiles figures from each company’s own sustainability or ESG report with a link to the page where each number is printed. The companion piece on energy and water per prompt looks at the same question from the other end, one request at a time.
The finding in numbers
Company reports answer the question of whether AI water usage is rising in two ways that point in opposite directions. As an intensity, water per unit of electricity, it is falling everywhere. As a total, it is rising everywhere.
The table holds every number in the three charts. Electricity is total company electricity as reported (purchased electricity for Alibaba and Baidu); water is the figure each company labels consumption; the ratio, in litres per kWh, is The Frontier Wire’s calculation.
| Company | Years compared | Electricity growth | Water growth | Water added (million m³) | L/kWh, prior | L/kWh, latest | Change in L/kWh |
|---|---|---|---|---|---|---|---|
| 2024 to 2025 | +37.4% | +33.6% | +10.35 | 0.971 | 0.944 | -2.8% | |
| Alibaba | FY2025 to FY2026 | +37.6% | +29.5% | +3.98 | 1.993 | 1.875 | -5.9% |
| Tencent | 2024 to 2025 | +34.8% | +17.2% | +1.78 | 1.613 | 1.402 | -13.1% |
| Microsoft | FY2024 to FY2025 | +24.1% | +22.1% | +1.48 | 0.224 | 0.221 | -1.3% |
| Meta | 2023 to 2024 | +20.2% | +1.5% | +0.05 | 0.201 | 0.170 | -15.4% |
| Baidu | 2024 to 2025 | +7.1% | +5.4% | +0.08 | 1.284 | 1.264 | -1.6% |
| All six | +29.6% | +26.9% | +17.71 | 0.722 | 0.707 | -2.1% |
The sources for each row are Google’s 2026 Environmental Report (water on page 96, electricity on page 93), Microsoft’s 2026 Environmental Data Fact Sheet (water on page 7, electricity on page 6), Meta’s 2025 Environmental Data Index, Tencent’s 2025 ESG Report, Alibaba’s 2026 ESG Report (filed with the SEC as a Form 6-K exhibit) and Baidu’s 2025 ESG Report.
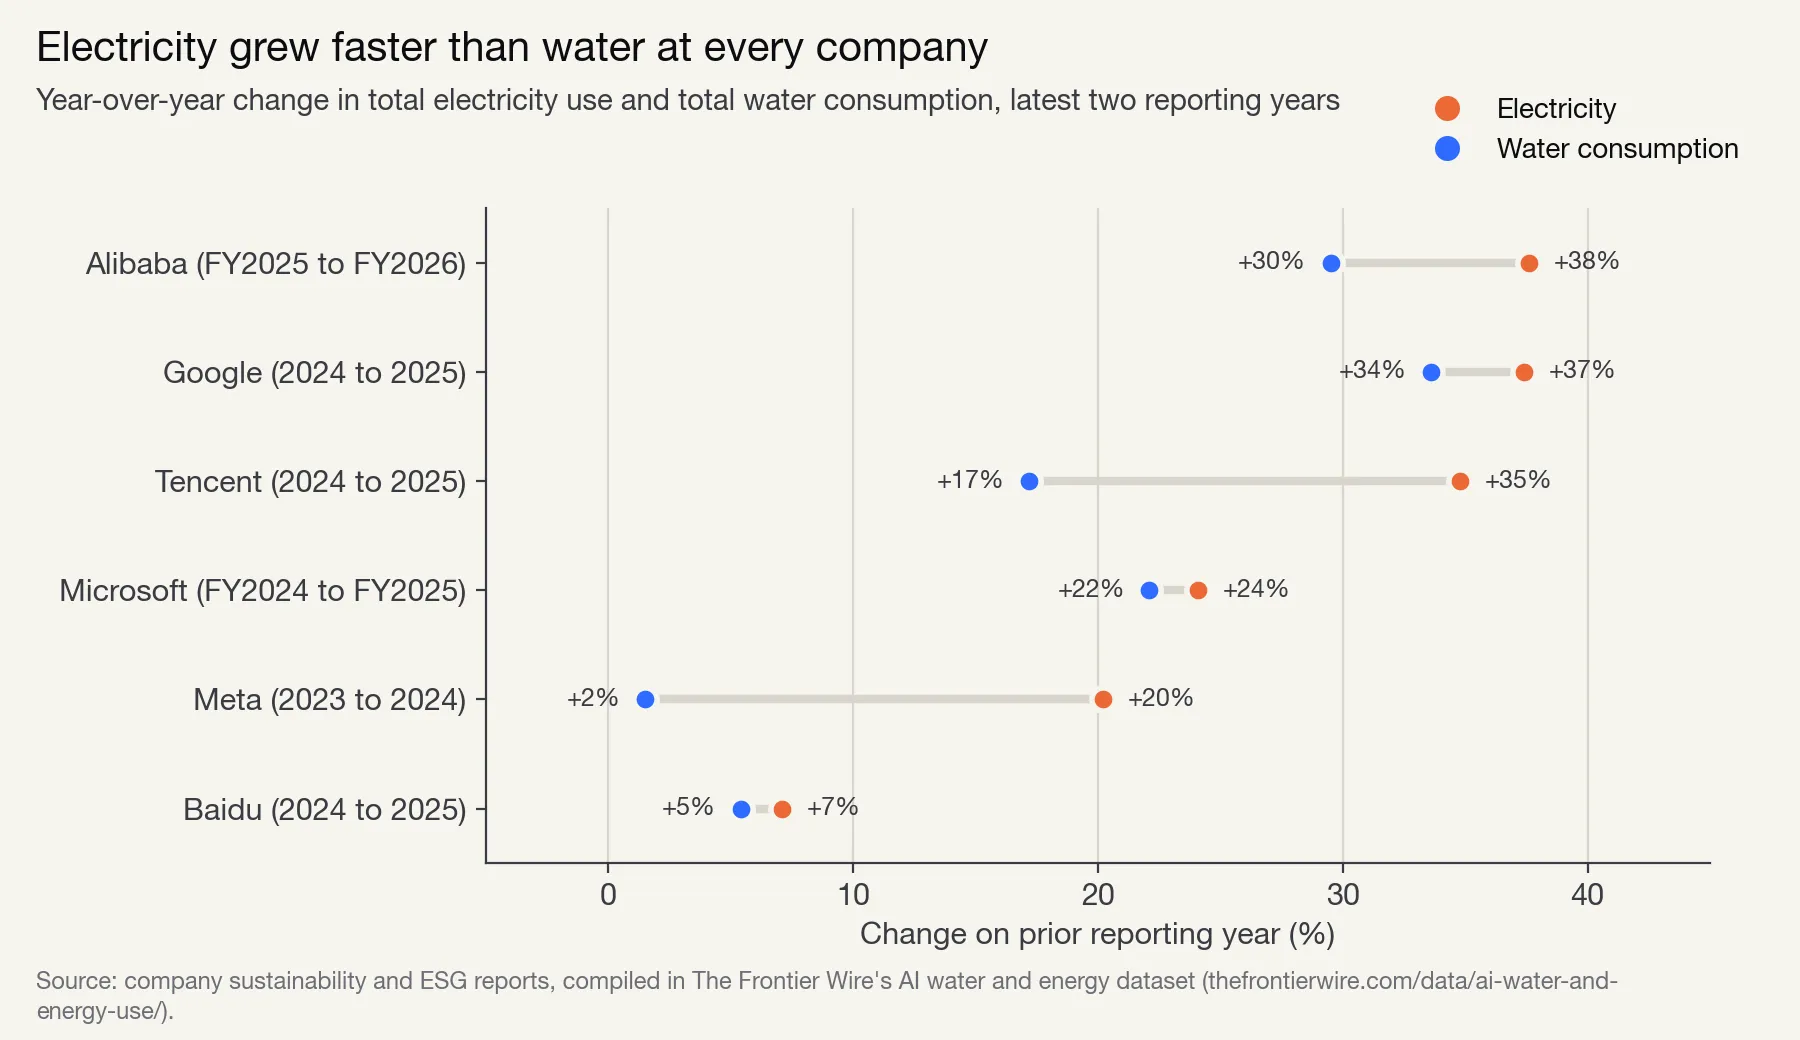 Figure 1: Electricity grew faster than water at every company. Year-over-year change in total electricity use (orange) and total water consumption (blue), latest two reporting years.
The gap between the dots on each row is the efficiency gain. It is wide at Meta and Tencent and narrow at Google and Microsoft, where water rose nearly in step with electricity. No water dot is at or below zero.
Water per kilowatt-hour
Figure 2 shows the same data as an intensity. Every hollow dot (prior year) sits to the right of its filled dot (latest year).
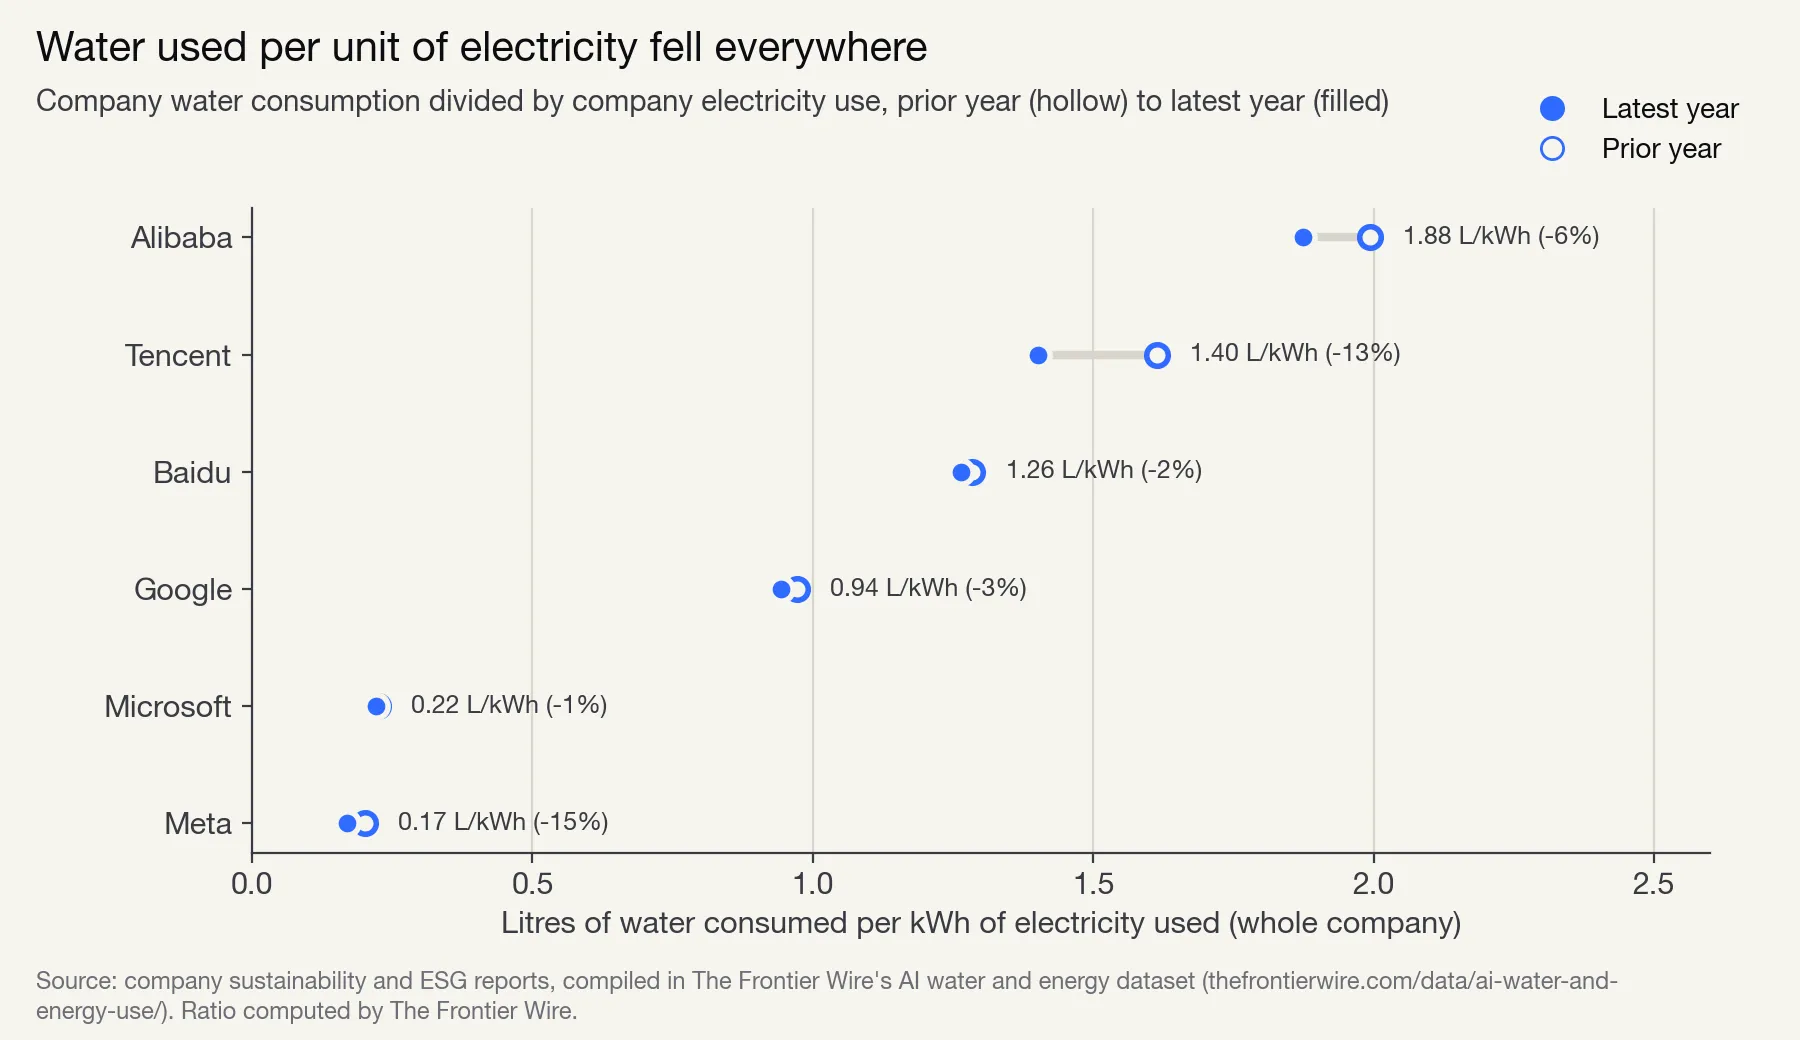 Figure 2: Water used per unit of electricity fell everywhere. Company water consumption divided by company electricity use, prior year (hollow) to latest year (filled).
The improvements are uneven. Meta’s ratio fell 15.4%, from 0.201 to 0.170 L/kWh, as its electricity rose by 3,098 GWh and its water consumption by only 45,000 m³. Tencent’s fell 13.1%. Google, Microsoft and Baidu moved by less than 3%. Alibaba sits in between at 5.9%.
One way to size the effect is a counterfactual: what each company would have consumed in its latest year if its water per kWh had stayed at the prior year’s level. Multiplying latest-year electricity by prior-year intensity gives about 4.8 million m³ more water across the six than was actually consumed. Tencent’s improvement accounts for 1.8 million m³ of that, Google’s for 1.2 million, Alibaba’s for 1.1 million and Meta’s for 0.6 million. Set against the 17.7 million m³ that was actually added, efficiency absorbed roughly a fifth of what growth would otherwise have required.
Pooled, the six companies used 91,208 GWh of electricity in their prior year and 118,242 GWh in their latest, a rise of 29.6%. Their combined water consumption went from 65.9 million m³ to 83.6 million m³, a rise of 26.9%. The pooled intensity fell only 2.1%, from 0.722 to 0.707 L/kWh, because Google and Alibaba, which grew most in absolute terms, improved modestly.
Absolute water consumption
Intensities describe engineering. Watersheds receive totals, shown in Figure 3.
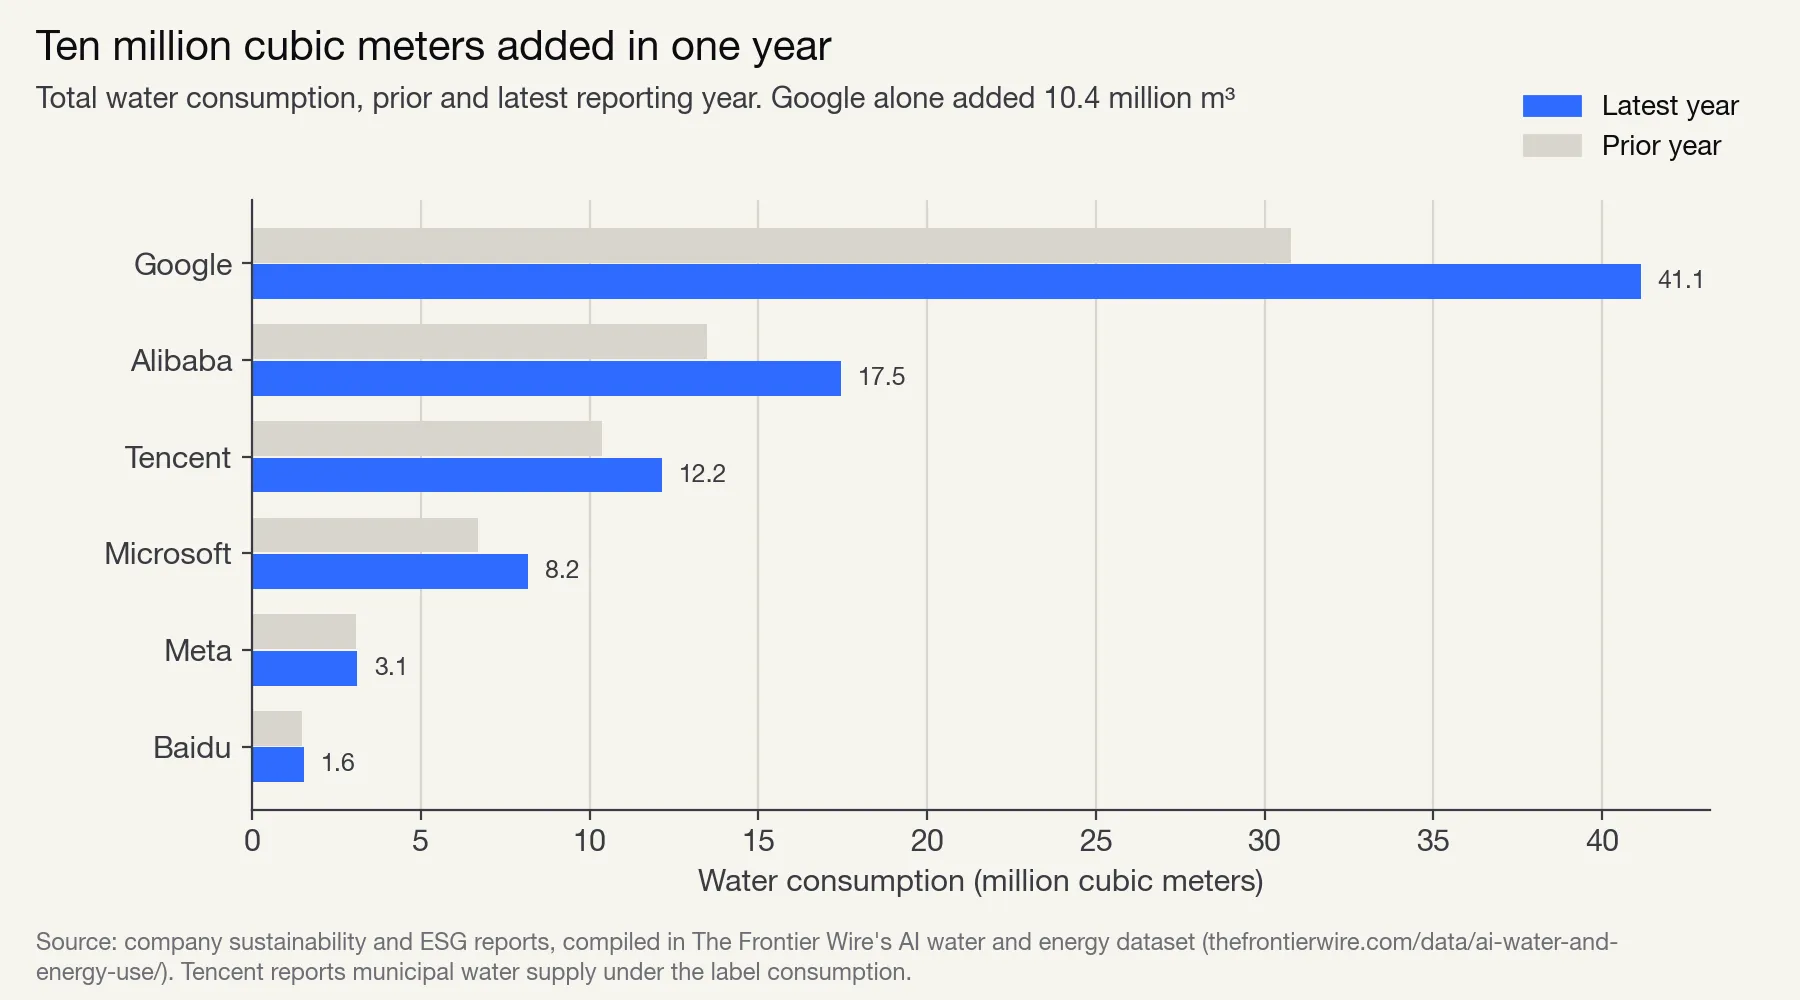 Figure 3: Total water consumption, prior and latest reporting year. Google alone added 10.4 million m³. Tencent and Alibaba report municipal supply labelled as consumption.
Google’s 2025 consumption was 10,869 million gallons (41.14 million m³), up from 8,135 million gallons (30.79 million m³) in 2024; its report states the 34% rise directly. Data centers account for 10,523 million gallons (39.83 million m³) of the 2025 total. Google’s single-year increase of 10.35 million m³ is larger than Microsoft’s entire FY2025 consumption of 8.17 million m³, and more than three times Meta’s 2024 total.
Withdrawal grew too: Google’s from 11,011 to 14,689 million gallons, Microsoft’s from a restated 11,590 to 13,266 megalitres. Microsoft states that it replenished more than 14.2 million m³ in FY2025, more than it withdrew; replenishment is a separate claim and is not netted here.
Colocation shows the same shape. Equinix reported 4,600 ML of consumption in 2025, 10% more than in 2024, while its WUE fell from 0.95 to 0.91. A change to its energy reporting boundary keeps it out of the six-company comparison.
Why the ratios differ 11-fold
The latest-year ratios run from 0.17 L/kWh at Meta to 1.88 L/kWh at Alibaba, a factor of 11. That spread is not a ranking of which company runs better data centers. Three things drive most of it.
Scope. Every ratio here is whole-company: data centers plus offices and other facilities. At Google and Meta, which also publish data-center-only figures, data centers account for most of both water and electricity. Tencent’s figures cover headquarters and wholly owned subsidiaries, Alibaba’s the whole group (a wider scope than Alibaba Cloud’s data centers) and Baidu’s Baidu Core. Non-server operations add water and electricity that move the ratio.
Climate and cooling design. Evaporative cooling, where water is evaporated to carry heat away, uses far more water than air cooling. Alibaba’s own report makes the size of this choice concrete: its WUE was 0.205 L/kWh at mainly air-cooled sites and 1.799 L/kWh at mainly evaporative sites, close to a ninefold difference within one company. Equinix reports the same pattern: 0.91 L/kWh across its portfolio but 1.41 at sites that use evaporative cooling. A company whose fleet leans toward evaporative cooling will show a high ratio even if each site is well run.
What is counted as water. Google, Microsoft, Meta and Baidu publish both withdrawal and consumption, so their consumption can be read as water not returned to its source, the GRI 303-5 definition the dataset uses. Tencent labels its figure consumption and states that all its water comes from municipal supply, so it behaves like a supply total. Alibaba labels its figure total water consumption and publishes no withdrawal number to check it against. If either is closer to withdrawal, its ratio is inflated relative to Google’s and Meta’s.
None of this affects the year-over-year comparison, because each company is compared only with itself. That is why this analysis leads with direction of change rather than levels.
Reported WUE versus the whole-company ratio
Most of these companies also publish a water usage effectiveness (WUE) figure, defined as litres of water per kWh of energy, usually IT energy, for data centers only. It is a different measure from the ratio in Figures 2 and 3, and the two rarely agree.
| Company | Year | Company-reported WUE (L/kWh) | What the WUE measures | Whole-company ratio, same year (L/kWh) |
|---|---|---|---|---|
| Meta | 2024 | 0.19 | Withdrawal divided by IT electricity, data centers | 0.170 |
| Microsoft | FY2025 | 0.27 | Datacenter water for cooling and humidification divided by energy use, owned datacenters | 0.221 |
| 2024 | 1.15 | Consumptive (ISO Category 2) value, stated in Google’s Gemini paper | 0.971 | |
| Alibaba | FY2026 | 1.198 | Alibaba Cloud self-built data centers | 1.875 |
| Alibaba | FY2025 | 1.144 | Alibaba Cloud self-built data centers | 1.993 |
| Tencent | 2025 | 1.50 | Owned data centers | 1.402 |
| Baidu | 2025 | 1.65 | Self-built data centers | 1.264 |
| Amazon | 2025 | 0.12 | Withdrawal per kWh of IT load, data centers | Not computable |
The WUE values come from Meta’s data index, Microsoft’s 2026 sustainability report, Google’s Gemini measurement paper (Google’s environmental report does not publish a fleet WUE), Alibaba’s ESG report, Tencent’s ESG report, Baidu’s ESG report and Amazon’s 2025 sustainability report.
Three differences explain the gaps. The denominator: WUE usually divides by IT energy, which is smaller than total facility electricity by the power usage effectiveness (PUE) factor, pushing WUE up. The numerator: Meta and Amazon count withdrawal, Google consumption, Microsoft water for cooling and humidification. The scope: WUE covers owned or self-built data centers only.
Alibaba is the clearest case of the two measures diverging. Its cloud WUE rose from 1.144 to 1.198 L/kWh between FY2025 and FY2026, a deterioration of about 5%, while its whole-company ratio fell 5.9%. Whether Alibaba became more or less water efficient depends on which number is read. Baidu’s data center WUE of 1.65 sits well above its company ratio of 1.26. Amazon cannot be placed on the company-ratio scale at all, because it reports withdrawal but not consumption and no data center electricity.
Withdrawal, consumption, on-site and off-site water
Four terms do most of the work in arguments about AI water usage, and they are often confused.
- Withdrawal is all water taken in from any source, municipal, surface or ground.
- Consumption is the share of withdrawal not returned, mostly water evaporated in cooling.
- On-site (direct) water is used at the data center itself, for cooling and humidification. All the company figures in this analysis are on-site, plus offices.
- Off-site (indirect) water is used to generate the electricity the data center draws. No company in the dataset reports it.
The macro estimates in the dataset’s grid table show that the indirect component is the larger one. Lawrence Berkeley National Laboratory estimates US data centers consumed 66 billion litres of water directly in 2023, up from 21.2 billion litres in 2014, with hyperscale and colocation facilities accounting for 84%. The same report puts the indirect water consumed to generate their electricity at nearly 800 billion litres, roughly 12 times the direct figure and equivalent to 4.52 litres per kWh on average.
The International Energy Agency reaches a similar split globally. Its Energy and AI report estimates data centres consume about 560 billion litres a year once electricity generation and chip manufacturing are included: about two-thirds from energy supply and electricity generation, one quarter from direct cooling, and the rest from semiconductor manufacturing. It projects about 1,200 billion litres by 2030.
An on-site figure of 0.17 or 0.22 L/kWh is small next to the 4.52 L/kWh LBNL attributes to average US generation. As an order-of-magnitude illustration only, multiplying Google’s 2025 electricity use of 43,586.6 GWh by LBNL’s US average would give about 197 million m³, nearly five times Google’s reported on-site consumption. That is not an estimate of Google’s actual indirect water: the factor is a US grid average, Google’s operations are global, and the mix of power it buys differs from the average grid. It shows only that the electricity side of the ledger can outweigh the cooling side. That is why the growth finding matters beyond the reported totals: whatever water each kWh carries at the power plant, electricity rose 7% to 38% at these six companies.
Companies with no public report
Several of the companies most associated with frontier AI publish nothing at the company level. OpenAI publishes no company water or electricity totals. Its only figure is a June 2025 blog post in which its CEO, Sam Altman, put an average ChatGPT query at about 0.34 Wh and 0.000085 gallons of water, without a method. Anthropic’s Form S-1, filed on October 26, 2026, discusses power and water for cooling as risk factors but discloses no volumes. xAI, part of SpaceX since February 2026, is covered by the SpaceX Form S-1/A of June 3, 2026, which discusses water scarcity as a risk to data center cooling and likewise discloses no water or electricity volumes.
Other large operators publish figures that cannot enter the comparison. Amazon reports 9.4 billion litres of data center withdrawal in 2025 and a WUE of 0.12 L/kWh, but no consumption figure and no data center electricity. Apple reports total water use of 1,796 million gallons in FY2025 without splitting withdrawal from consumption. Oracle reports potable water use and total energy, not electricity. All are in the companies table with their own units.
Per-prompt efficiency and fleet totals
Google’s Gemini measurement paper reports 0.24 Wh and 0.26 mL of water for a median Gemini Apps text prompt in May 2025, and says energy per median prompt fell 33 times over the prior 12 months. Google’s next annual report showed total water consumption up 34%. Both are accurate: per-unit costs fall, and volume grows faster. The sibling analysis of energy per prompt estimates shows why per-request figures vary by more than three orders of magnitude, and reasoning models, covered in the reasoning-model cost problem, are one reason the work per request keeps climbing.
For organizations that consume AI, the levers that cut spend also cut the electricity behind it: smaller models for simple requests, caching and capped agent loops, set out in the LLM cost optimization playbook and measurable with the per-call records described in running an AI gateway in front of every model call. Teams that self-host models choose their own cooling and location, and so where on the 0.2 to 1.8 L/kWh range they land.
Method
Rows used. The analysis uses the companies table of the AI water and energy use dataset, downloadable as companies.csv. A company was included only if it has two consecutive reporting years with a numeric value in both the consumption_mm3 and electricity_gwh columns. Six companies qualify: Google (2024, 2025), Microsoft (FY2024, FY2025), Meta (2023, 2024), Tencent (2024, 2025), Alibaba (FY2025, FY2026) and Baidu (2024, 2025). Amazon, Apple, Oracle, IBM, Equinix and Digital Realty are excluded because they lack consumption, electricity or a comparable second year. Microsoft’s FY2024 values are the restated figures printed in its 2026 fact sheet.
Units. The dataset normalizes water to million m³ (1 US gallon = 3.785411784 litres; 1 megalitre = 1,000 m³; 1 tonne = 1 m³) and electricity to GWh. Litres per kWh equals million m³ divided by GWh, times 1,000.
Formulas. For each company and year:
- Intensity (L/kWh) =
consumption_mm3 × 1000 / electricity_gwh - Electricity growth (%) =
(electricity_latest / electricity_prior − 1) × 100 - Water growth (%) =
(water_latest / water_prior − 1) × 100 - Intensity change (%) =
(intensity_latest / intensity_prior − 1) × 100 - Water added (million m³) =
water_latest − water_prior - Counterfactual water at constant intensity (million m³) =
electricity_latest × intensity_prior / 1000; water avoided = counterfactual minus actual latest water. - Pooled figures sum water and electricity across the six companies before dividing.
Intensities were computed from the unrounded normalized values and then rounded to three decimals, so recomputing from rounded table values can differ in the last digit. Growth rates and intensity changes are rounded to one decimal. The charts were drawn with matplotlib from these values. The illustrative indirect water figure for Google is 43,586.6 GWh × 4.52 L/kWh, using LBNL’s US average from the grid table.
Reproducing it. Open companies.csv, filter to the six companies, take the two rows per company, and apply the formulas above. No other data is needed.
What the data cannot show
AI’s share. No company reports AI workloads separately. The totals include every service, cloud customer and office, so the analysis cannot attribute the rise to AI.
One year of change. Each company contributes one year-over-year step. A single year cannot establish a trend, and a single new evaporative-cooled campus can move a company’s ratio on its own. Meta’s latest published data covers 2024, a year behind most of the others.
Non-matching periods. Microsoft’s fiscal year ends in June and Alibaba’s in March, so pooled figures add periods that do not line up exactly.
Comparability of levels. Because of the Tencent and Alibaba water definitions, cross-company ratio levels are indicative only. The same applies to WUE: Meta’s published WUE of 0.19 cannot be reproduced from the data center withdrawal and electricity totals in the same index, which give about 0.23 L/kWh on total electricity, so the exact boundaries behind its WUE are not visible from the published totals.
Local stress. A cubic meter evaporated in an arid basin matters more than one in a wet region. The totals carry no location data.
Indirect water. No company reports the water used to generate its electricity. The IEA and LBNL estimates in the grid table are sector-wide, and the Google calculation above is an illustration, not a measurement.
Replenishment. Replenishment claims are not netted against consumption; that would need project-level data.
Efficiency is not a ceiling
The reports say two true things at once. Water per kWh fell at every company with the data to check, by as much as 15%. Electricity grew faster, so total consumption rose at every one of them, by about 17.7 million m³ in a single year across six firms; Google’s increase alone exceeded Microsoft’s entire annual consumption.
Neither number should be quoted without the other. On the companies’ own figures, efficiency has slowed the rise in water use by roughly a fifth without stopping it. Until electricity growth slows or intensity falls faster than electricity rises, the total will keep going up, and the larger, unreported share of water, the part used at power plants, will rise with every additional kilowatt-hour. Anyone wanting to check that conclusion against next year’s reports can do so from the dataset and the method above.
Sources
- The Frontier Wire: AI water and energy use, the disclosed numbers (dataset)
- Google 2026 Environmental Report
- Measuring the environmental impact of delivering AI at Google Scale (arXiv 2508.15734)
- Microsoft 2026 Environmental Data Fact Sheet
- Microsoft 2026 Environmental Sustainability Report
- Meta 2025 Environmental Data Index
- Tencent Environmental, Social and Governance Report 2025
- Alibaba Group ESG Report 2026 (SEC Form 6-K exhibit 99.2)
- Baidu 2025 Environmental, Social and Governance Report
- 2025 Amazon Sustainability Report
- Equinix 2025 Sustainability Report
- Apple Environmental Progress Report 2026
- Oracle Environmental and Social Impact FY26 Datasheet
- IEA, Energy and AI (April 2025)
- LBNL, 2024 United States Data Center Energy Usage Report
- Anthropic, PBC Form S-1 (October 26, 2026)
- Space Exploration Technologies Corp. Form S-1/A (June 3, 2026)
- Sam Altman: The Gentle Singularity (June 2025)
Questions readers ask
How much water does AI use?
No company reports AI water use separately from the rest of its data centers and offices. Company-wide water consumption was 41.1 million m³ at Google in 2025, 8.2 million m³ at Microsoft in FY2025 and 3.1 million m³ at Meta in 2024. The IEA estimates all data centres worldwide consume about 560 billion litres a year once electricity generation and chipmaking are counted, and projects about 1,200 billion litres by 2030.
Is AI water usage getting more efficient?
Per unit of electricity, yes. At all six companies in this analysis, water consumed per kWh of electricity fell between the two latest reporting years, by 1.3% at Microsoft up to 15.4% at Meta. Total consumption still rose at all six, by 1.5% at Meta up to 33.6% at Google, because electricity use grew by 7% to 38%.
Why does Alibaba use 11 times more water per kWh than Meta?
The ratio in this analysis divides whole-company water by whole-company electricity, so it reflects where the data centers are, how they are cooled and what each company counts as water. Alibaba's own data shows 0.205 L/kWh at mainly air-cooled sites and 1.799 L/kWh at mainly evaporative sites. Tencent's figure is municipal supply labelled as consumption, and Alibaba publishes no separate withdrawal figure, so neither is measured on the same basis as Meta's consumption.
What is the difference between water withdrawal and water consumption?
Withdrawal is all the water a company takes in. Consumption is the part that is not returned to its source, mostly water evaporated in cooling towers. Google withdrew 14,689 million gallons in 2025 and consumed 10,869 million gallons.
Do OpenAI, Anthropic and xAI report their water use?
No. None publishes company-level water or electricity totals. Anthropic's S-1 and the SpaceX S-1/A that covers xAI discuss water for cooling as a risk factor but disclose no volumes. OpenAI's only figure is a per-query estimate in a June 2025 blog post by its CEO.