
AI energy per prompt estimates span 2,300-fold, but typical text prompts agree at 0.24 to 0.42 Wh
The Frontier Wire compared every per-prompt energy and water figure in its dataset. The extremes differ 2,300-fold for energy and over 1,600-fold for water, but four independent estimates for an ordinary text prompt sit within a factor of 1.75. Scope, request length and modality explain the rest.
Published estimates of AI energy consumption per request differ by a factor of about 2,300: from 0.047 watt-hours for the mean text query on small open models to 109.47 Wh for one short clip from an open video model. Water figures per prompt differ by more than 1,600-fold. Yet when The Frontier Wire lined up every per-prompt figure in its AI water and energy dataset, the four independent estimates for an ordinary text prompt to a large production model landed within a narrow band of 0.24 to 0.42 Wh, a factor of 1.75 from lowest to highest. The disagreement that dominates public debate is mostly not disagreement at all. It comes from three choices: what each study counts, how long and how much reasoning the request involves, and whether the output is text, an image or a video.
TL;DR
- Four independent figures for a typical text prompt cluster tightly: Google 0.24 Wh, Microsoft Research 0.31 Wh, OpenAI’s CEO 0.34 Wh and Jegham et al. 0.42 Wh for GPT-4o.
- Long, reasoning-heavy queries are estimated at 29.08 to 33.8 Wh, about 99 times the 0.34 Wh ChatGPT average. One short video clip from WAN2.1 14B measured 109.47 Wh.
- Scope moves numbers by itself: Google’s comprehensive method gives 2.4 times the energy and 2.2 times the water of its own narrow method for the same prompt.
- Water per prompt ranges from 0.12 mL (on-site cooling only) to over 200 mL (adding power-plant water), so a water figure without a stated scope cannot be compared.
- Per-prompt figures cannot be multiplied up to the grid. The IEA puts data centres at 415 TWh in 2024 and 945 TWh in 2030, but those totals include training, idle capacity and non-AI work.
The per-prompt figures side by side
The dataset’s per-prompt table holds every per-request disclosure or research estimate that could be checked against its original document. Eleven of them give an energy figure for a single request, image or clip. Figure 1 plots them on a logarithmic scale, where each gridline is ten times the one before, and colours them by the kind of request measured.
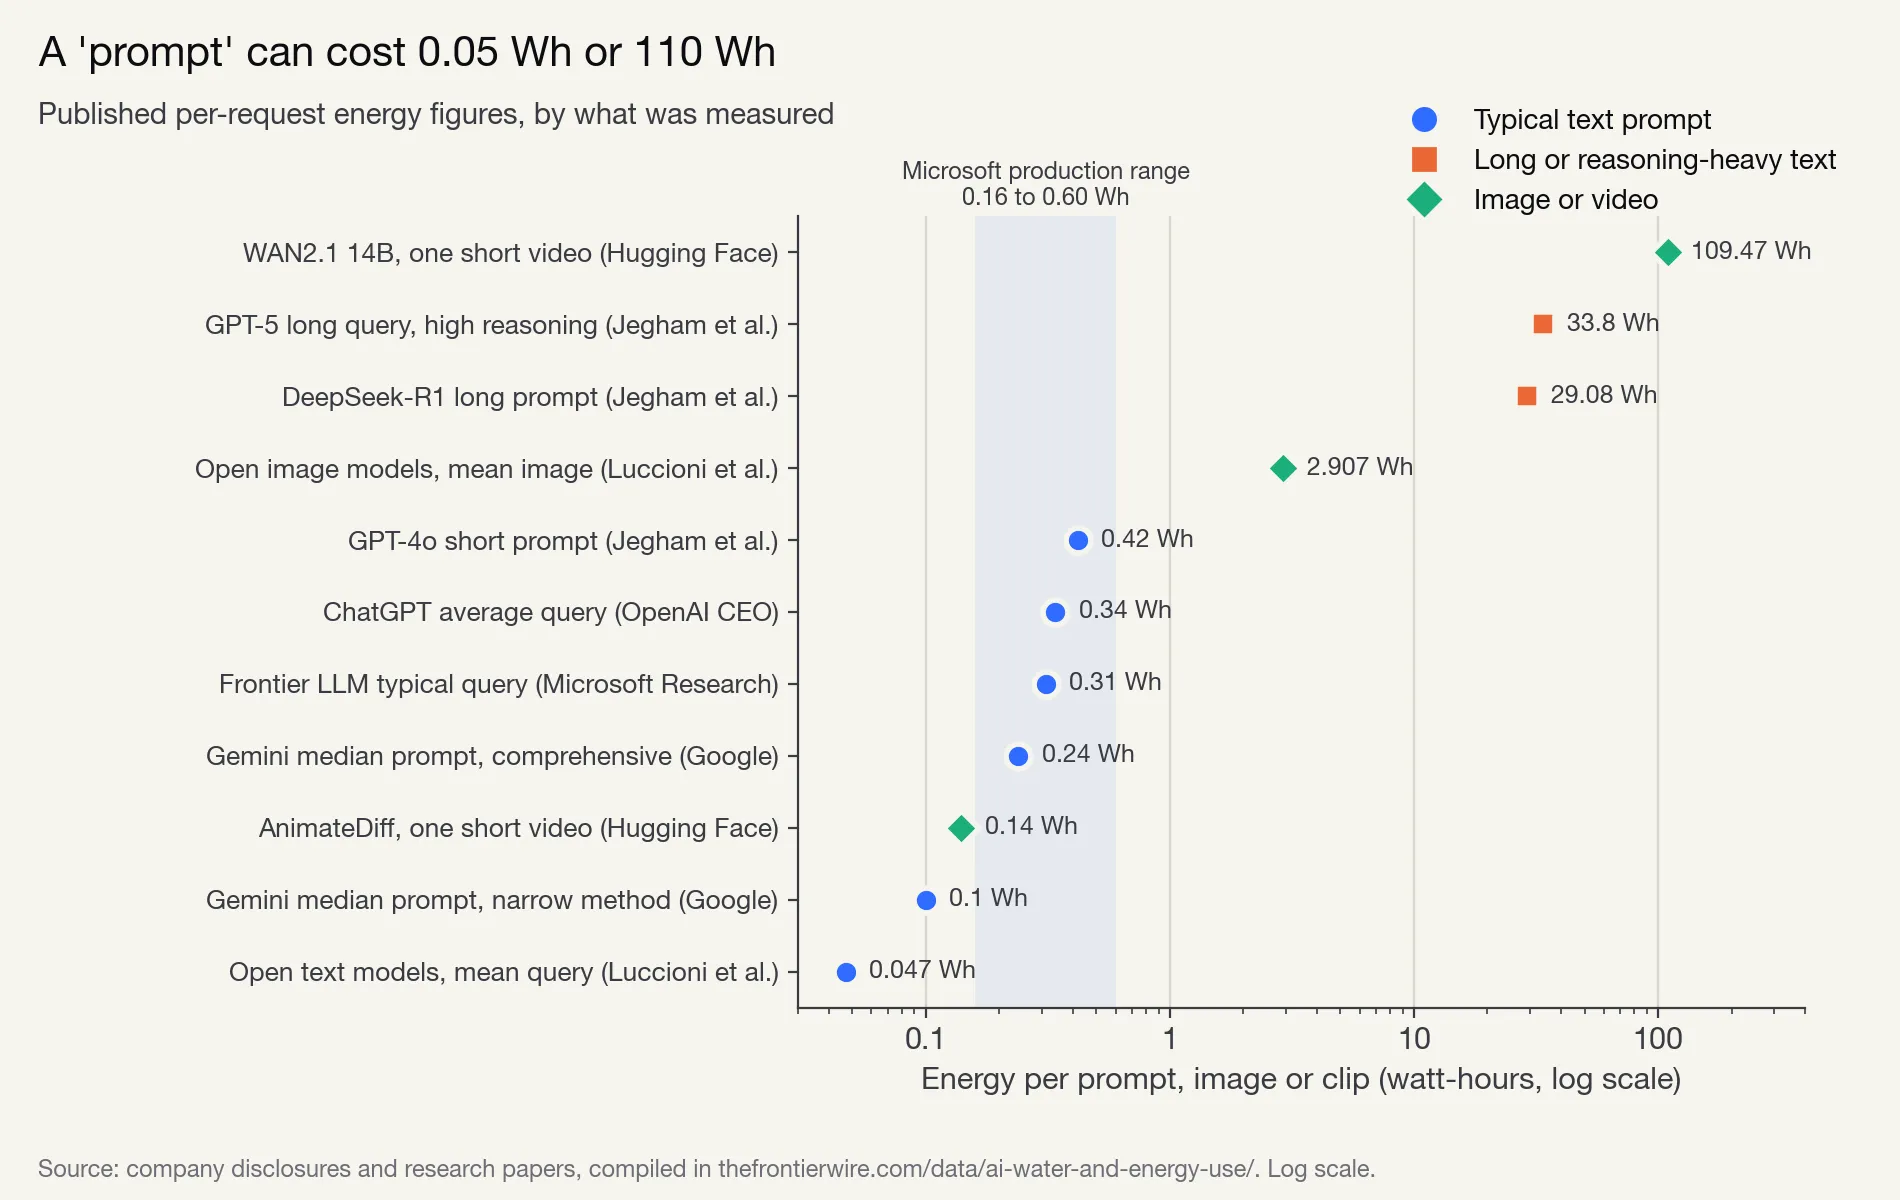 Figure 1: Published per-request energy figures, coloured by typical text prompt, long or reasoning-heavy text, and image or video. The shaded band is Microsoft’s 0.16 to 0.60 Wh range for a typical production query.
The same figures as text, with the scope each source states:
| Request measured | Source | Energy (Wh) | Water (mL) | What is counted |
|---|---|---|---|---|
| Open text models, mean query | Luccioni et al. | 0.047 | not given | Inference on A100 GPUs, small open models |
| Gemini Apps median text prompt, narrow | 0.10 | 0.12 | Active accelerators only; on-site water | |
| AnimateDiff, one short video | Hugging Face | 0.14 | not given | One H100: GPU, CPU and RAM |
| Gemini Apps median text prompt, comprehensive | 0.24 | 0.26 | Accelerators, host CPU and RAM, idle machines, facility overhead; on-site water | |
| Frontier-scale LLM, typical query | Microsoft Research (Joule) | 0.31 (range 0.16 to 0.60) | 0.0 to 0.067 | Bottom-up model of optimized production serving; on-site water from Microsoft’s blog |
| ChatGPT average query | OpenAI CEO | 0.34 | 0.32 | Not stated |
| GPT-4o, short prompt | Jegham et al. | 0.42 | not given | Estimated from API throughput plus assumed hardware and overhead |
| Open image models, mean image | Luccioni et al. | 2.907 | not given | Inference on A100 GPUs |
| DeepSeek-R1, long prompt | Jegham et al. | 29.08 | over 200 | Estimated; water includes on-site and electricity generation |
| GPT-5, long query, high reasoning | Jegham et al. | 33.8 | not given | Estimated average |
| WAN2.1-T2V-14B, one short video | Hugging Face | 109.47 | not given | One H100: GPU, CPU and RAM, no facility overhead |
| Le Chat, 400-token response (Mistral Large 2) | Mistral AI | not given | 45 | Life cycle assessment including server manufacturing |
Read down the energy column and the spread looks absurd; read across to the last column and most of it explains itself. The bottom is a small open model on its own GPU, the top a 14-billion-parameter video model rendering 81 frames. Neither is what most people mean when they ask how much energy ChatGPT uses.
Four typical text estimates that agree
Four figures describe a typical text request to a large production model, and they come from four different kinds of source:
- Google, 0.24 Wh. A measurement of the median Gemini Apps text prompt in May 2025, published in a technical paper with its accounting boundary spelled out. It is the dataset’s headline Gemini figure.
- Microsoft Research, 0.31 Wh. A peer-reviewed bottom-up model in Joule (Oviedo et al.) of a frontier-scale model under optimized production serving, with an interquartile range of 0.16 to 0.60 Wh.
- OpenAI’s CEO, 0.34 Wh. A single sentence in Sam Altman’s June 2025 blog post, with no method, model or date range attached. It is the dataset’s ChatGPT figure.
- Jegham et al., 0.42 Wh. An outside estimate for GPT-4o with 100 input and 300 output tokens, built from public API throughput and assumed hardware, power usage effectiveness and grid factors.
The ratio of the highest to the lowest is 0.42 / 0.24 = 1.75. Their median is 0.325 Wh. All four fall inside Microsoft’s 0.16 to 0.60 Wh range, which is itself only 3.75 times wide. For estimates that use different models, different years and in one case no stated method at all, that is close agreement. It is also the most useful single answer to the question of how much energy a ChatGPT-style prompt uses: about a third of a watt-hour, for a short text exchange, inference only.
The agreement does not prove each number right: Altman’s figure cannot be checked, and Jegham et al. rely on assumed hardware. But Google and Microsoft Research describe their accounting in detail, and the other two land near them.
What is counted
The most direct demonstration that scope moves the number comes from a single company measuring a single prompt two ways. Google’s paper reports the median Gemini text prompt under a narrow method, counting only the active TPUs and GPUs, and a comprehensive method that adds host CPUs and memory, machines held idle for reliability and peak load, and data centre overhead such as cooling and power conversion.
| Gemini median text prompt | Narrow method | Comprehensive method | Ratio |
|---|---|---|---|
| Energy (Wh) | 0.10 | 0.24 | 2.4x |
| Water, on-site (mL) | 0.12 | 0.26 | 2.2x |
| Emissions (gCO2e) | 0.02 | 0.03 | 1.5x |
The narrow figure is, in the dataset’s notes, “comparable to many earlier public estimates.” A study that measures only accelerator energy is not wrong; it answers a narrower question, and gets less than half the whole-system figure for the same request.
Jegham et al. show the same effect in miniature: their GPT-4o short-prompt estimate is 0.42 Wh with data centre overhead and 0.37 Wh without it. The Hugging Face video measurements go the other way, including CPU and RAM alongside the GPU (93.83 + 10.47 + 5.17 Wh for WAN2.1) but explicitly excluding facility overhead. Luccioni et al. measured A100 GPUs running small open models, and their mean text figure of 0.047 Wh comes with a note in the dataset that the models tested are “far smaller than current frontier chat models.”
At the far end, Mistral’s figure for Le Chat is a life cycle assessment conducted with Carbone 4 and ADEME. It includes the upstream impact of manufacturing servers, which is why its water figure is two orders of magnitude above on-site cooling figures. Mistral disclosed no energy per prompt.
The scale of these boundary choices also shows up at the macro level. The IEA’s Energy and AI report estimates that only about one quarter of data centre water use is direct cooling; about two thirds comes from energy supply and electricity generation, and the rest from semiconductor manufacturing.
Request length and reasoning effort
The second driver is the request itself. Jegham et al. estimate a long GPT-5 query at high reasoning effort at 33.8 Wh, and a long DeepSeek-R1 prompt (10,000 input and 1,500 output tokens) on DeepSeek’s own servers at 29.08 Wh. Against the 0.34 Wh ChatGPT average:
- 33.8 / 0.34 = 99.4, so a long high-reasoning GPT-5 query is about 99 times a typical prompt.
- 29.08 / 0.34 = 85.5 for the DeepSeek-R1 long prompt.
- Against Google’s 0.24 Wh, the GPT-5 figure is 141 times larger.
The comparison within a single model is sharper still. The same paper estimates a short GPT-5 query with minimal reasoning at 0.67 Wh, so moving from short and minimal to long and high reasoning multiplies the estimate by 33.8 / 0.67 = 50.
This is the energy side of a pattern already visible on the invoice. Reasoning models generate long chains of intermediate tokens before answering, and, as The Frontier Wire’s analysis of reasoning-model pricing sets out, those tokens are billed as output. Test-time compute is the deliberate choice to spend more computation per request to get a better answer; it is also, on these estimates, a choice to spend one to two orders of magnitude more energy. The Microsoft Research study’s title, “Energy use of AI inference, efficiency pathways, and test-time scaling,” puts the same link in its framing, and the dataset notes that longer reasoning or agentic queries use more than its 0.31 Wh median.
Jegham et al.’s method estimates energy from inference time derived from published throughput, so in their framework more tokens processed means more energy. The practical levers that shrink a token bill, such as right-sizing the model, capping output and reasoning effort, and trimming context (covered in the LLM cost optimization playbook and the prompt caching guide), act on the same quantity. None of the sources in the dataset measures the energy saved by any specific technique, so this analysis does not put a number on it. Models that avoid generating text at all, such as the System One models that return typed decisions, are a different design point again, with no published energy figures yet.
Hardware and serving
The third variable inside the text figures is where and how the model runs. Jegham et al. estimate the same DeepSeek-R1 long prompt at 29.08 Wh on DeepSeek’s servers and 7.41 Wh on Azure, a factor of 29.08 / 7.41 = 3.9 for identical work on different infrastructure. Their water estimate falls with it, from over 200 mL to about 34 mL.
Microsoft’s own framing is about serving efficiency: its June 2026 blog on the Joule study is titled “Scaling AI with 8 to 20x energy efficiency,” and the 0.31 Wh figure is explicitly for optimized production serving. Google’s paper, in the dataset’s notes, reports that energy per median Gemini prompt fell 33-fold over the twelve months before May 2025. Any per-prompt figure is therefore a snapshot of one fleet on one date.
Images and video
Modality is the last and largest source of spread. Luccioni et al. measured a mean of 2.907 Wh per image across open image-generation models (reported as 2.907 kWh per 1,000 inferences, with a standard deviation of 3.31), and 11.49 Wh per image for the least efficient model tested. The image mean is 2.907 / 0.34 = 8.5 times the ChatGPT text average.
Video spans the widest range of all. In Hugging Face’s measurements on one H100, AnimateDiff produced a 16-frame, 512 by 512 clip for 0.14 Wh, while WAN2.1-T2V-14B produced an 81-frame, 480 by 832 clip for 109.47 Wh. That is a 782-fold difference between two open video models. The WAN2.1 clip alone is 322 times the ChatGPT text average. “One video” is as underspecified as “one prompt.”
Excluding images and video, the text-only span runs from 0.047 to 33.8 Wh, a factor of 719, almost all of it explained by method, model size and reasoning length.
Water per prompt depends on the boundary
Water figures are even less comparable than energy, because there are two very different kinds of water in play. On-site water is used at the data centre, mostly evaporated in cooling. Off-site, or indirect, water is used to generate the electricity the data centre draws. Life cycle figures add the water embodied in manufacturing the hardware.
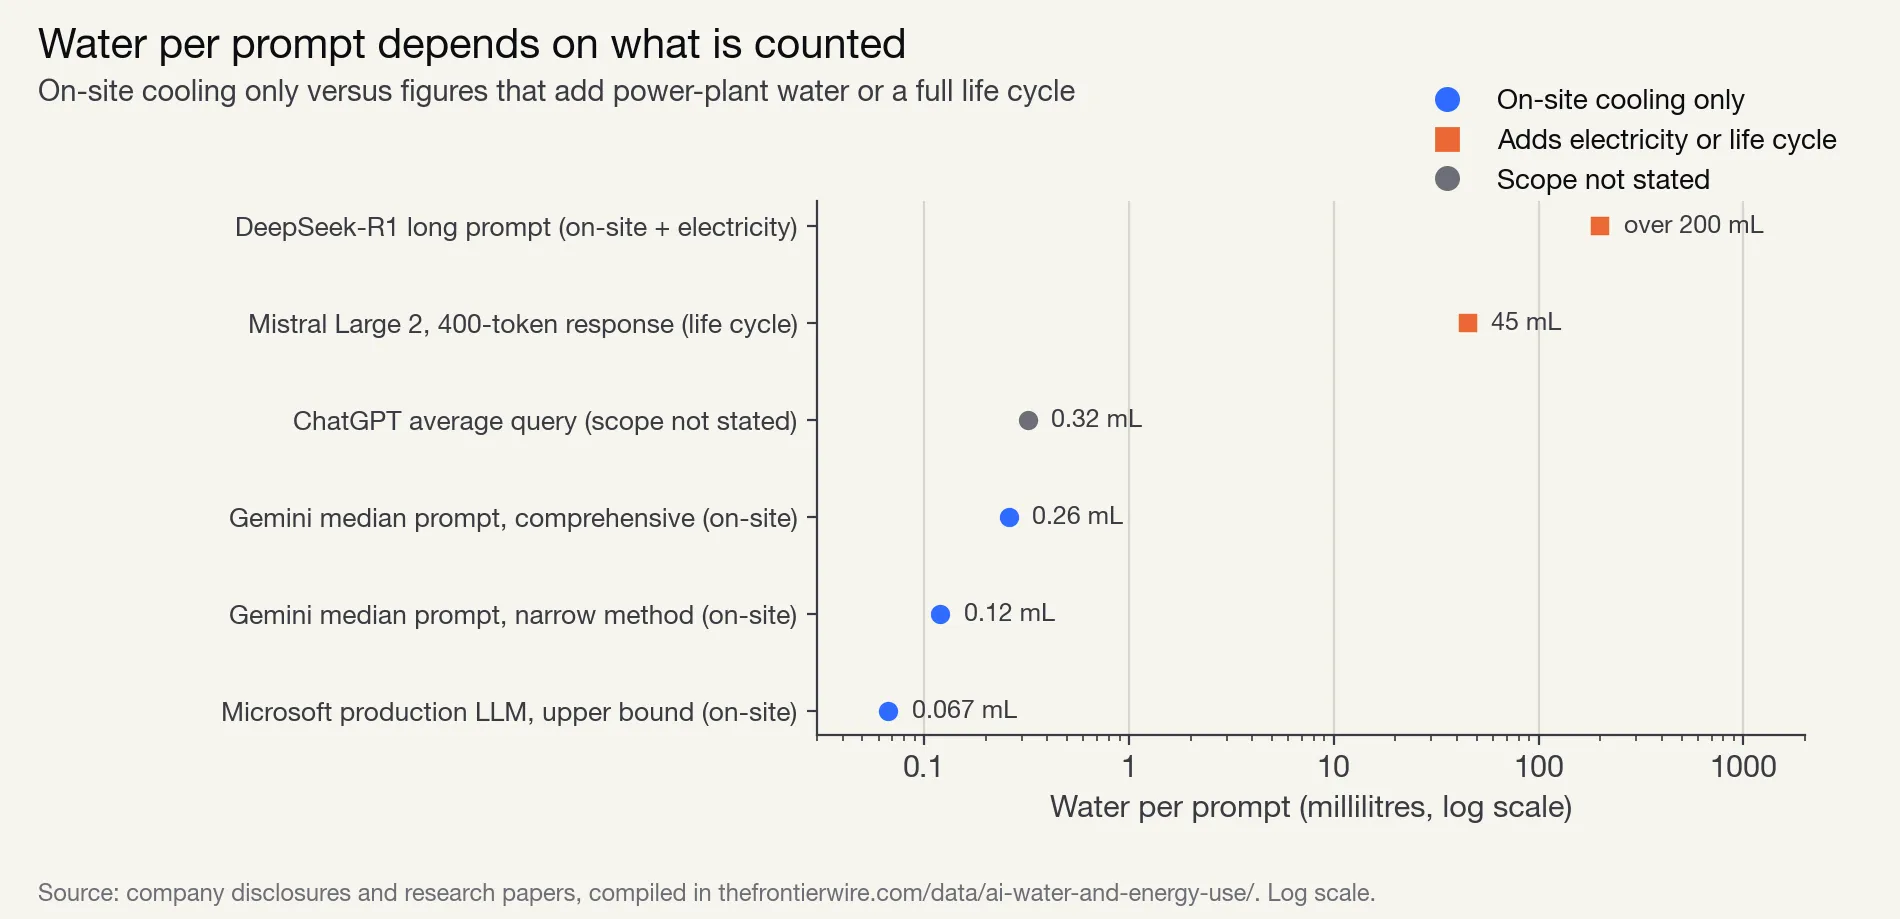 Figure 2: Water per prompt by scope. On-site cooling figures sit below 0.3 mL; figures that add electricity generation or a hardware life cycle run from 45 mL to over 200 mL.
| Request | Water (mL) | Scope | Source |
|---|---|---|---|
| Large production LLM, typical query | 0.0 to 0.067 | On-site cooling | Microsoft |
| Gemini median text prompt, narrow | 0.12 | On-site | |
| Gemini median text prompt, comprehensive | 0.26 | On-site | |
| ChatGPT average query | 0.32 | Not stated | OpenAI CEO |
| Le Chat 400-token response | 45 | Life cycle, including hardware manufacturing | Mistral AI |
| DeepSeek-R1 long prompt, DeepSeek servers | over 200 | On-site plus electricity generation | Jegham et al. |
From Google’s narrow 0.12 mL to DeepSeek-R1’s “over 200” mL is a ratio of more than 1,667. (Microsoft’s range is excluded from the ratio because its lower bound is zero.) That spread mixes all three drivers at once: a different boundary, a prompt roughly 30 times longer than a short chat turn, and less efficient hardware.
How much the boundary alone matters can be shown with numbers already in the dataset. Berkeley Lab’s 2024 report puts the average indirect water intensity of electricity used by US data centers at 4.52 litres per kWh. Applying that average to Google’s 0.24 Wh prompt gives 0.00024 kWh × 4.52 L/kWh = 1.08 mL of off-site water, about four times the 0.26 mL Google counts on site. This is an illustration, not an estimate of Gemini’s actual footprint: Google’s electricity mix is not the US average, and the 4.52 figure is a US-wide mean. But it shows why a figure that adds power-plant water will sit well above an on-site figure for the same prompt, with no disagreement about the underlying energy.
Altman’s 0.32 mL (The Frontier Wire’s conversion of his “0.000085 gallons”) works out to 0.94 mL per Wh, close to Google’s 1.08 mL per Wh and to the on-site water intensities companies report. That ratio is consistent with an on-site-only figure, but OpenAI has not said what the number covers, so this analysis does not treat it as one. Anyone looking up ChatGPT water per prompt should read 0.32 mL as an unscoped statement, not a measurement. The sibling analysis of company water use against efficiency covers the company-level totals that sit behind these per-prompt numbers.
From prompts to the grid
Per-prompt numbers are small, and grid numbers are large. The dataset’s grid table holds the macro estimates from the IEA and Lawrence Berkeley National Laboratory. They cover all data centres, not only AI.
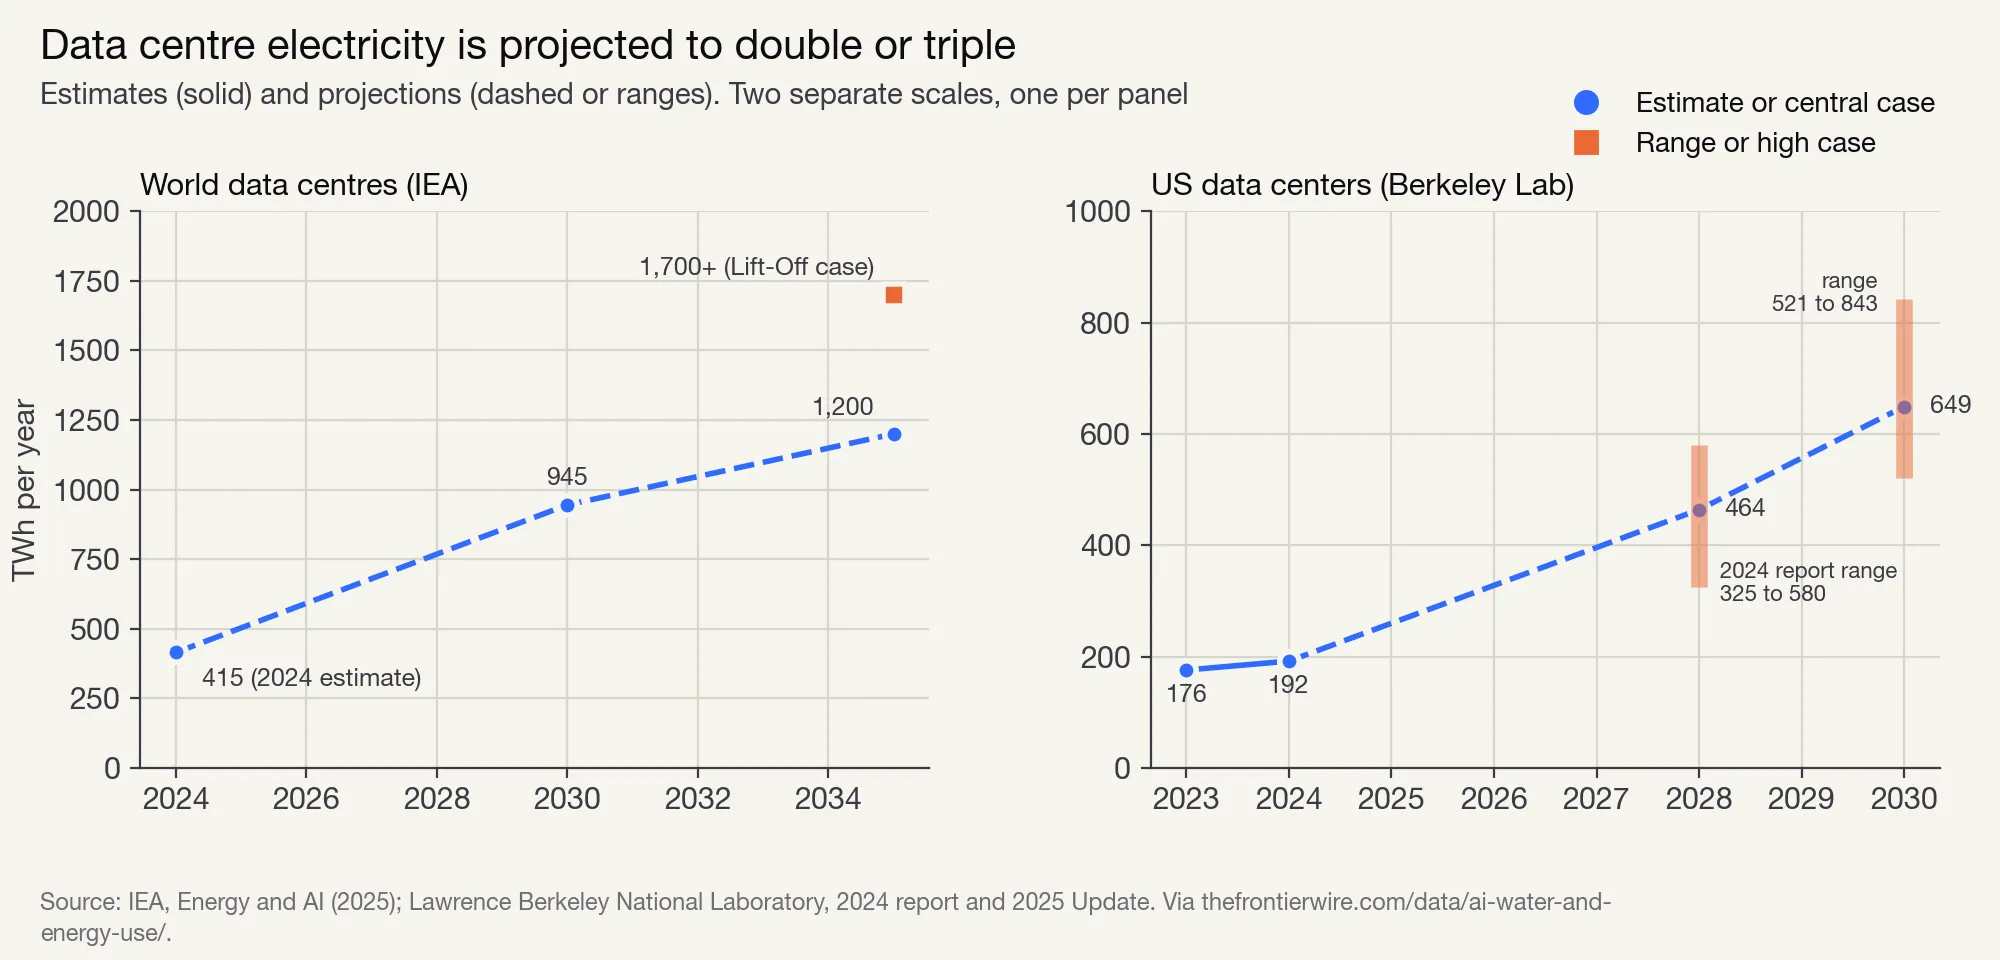 Figure 3: Data centre electricity, world (IEA) and United States (Berkeley Lab). Solid lines are estimates; dashed lines and bars are projections and ranges. Each panel has its own scale.
| Geography | Year | TWh | Share of electricity | Kind | Source |
|---|---|---|---|---|---|
| World | 2024 | 415 | about 1.5% | Estimate | IEA |
| World | 2030 | 945 | just under 3% | Base Case projection | IEA |
| World | 2035 | around 1,200 (cases 700 to 1,700) | not given | Base Case projection | IEA |
| United States | 2023 | 176 | 4.4% | Estimate | LBNL 2024 |
| United States | 2024 | 192 | 4.7% | Estimate | LBNL 2025 Update |
| United States | 2028 | 464 (2024 report range 325 to 580) | not given | Reference Case projection | LBNL 2025 Update |
| United States | 2030 | 649 (range 521 to 843) | 11.8% | Reference Case projection | LBNL 2025 Update |
The IEA’s Base Case implies data centre electricity growing by a factor of 945 / 415 = 2.28 between 2024 and 2030, or about 14.7% a year compounded, matching the IEA’s own “about 15% a year.” Within that, the IEA expects electricity use in accelerated, mainly AI, servers to grow about 30% a year, against about 9% for conventional servers. Berkeley Lab’s Reference Case for the United States is steeper: 649 / 192 = 3.38 times between 2024 and 2030, about 22.5% a year. The IEA 2024 figure, its 2030 projection and the US 2024 estimate each have a stat anchor on the dataset page.
Why per-prompt figures do not multiply up
It is tempting to take 0.34 Wh, multiply by a number of prompts per day, and arrive at AI’s share of the grid. The Frontier Wire did not do that, for four reasons.
Training is excluded. Every per-prompt energy figure in the table is inference only. Google’s paper excludes training, networking and user devices. The one life cycle study, Mistral’s, reports training plus 18 months of use of Mistral Large 2 separately, at 20.4 ktCO2e and 281,000 m³ of water.
Idle and overhead capacity is counted inconsistently. Google’s comprehensive method allocates idle machines and facility overhead to each prompt; its narrow method, the Luccioni measurements and the Hugging Face video measurements do not. Multiplying a narrow figure up would miss more than half of what Google’s own comprehensive accounting attributes to the same prompt.
Grid totals include everything else. The IEA and Berkeley Lab figures cover every data centre workload: storage, web services, enterprise software, streaming and conventional cloud computing as well as AI. The IEA’s split between accelerated and conventional servers is a projection of growth rates, not a measured count of prompts.
Volumes and mix are not public. No company in the dataset discloses how many prompts it serves, or what share are long reasoning queries, image generations or agent loops. Because a long reasoning query is about 100 times a short one, the mix matters more than the count.
The arithmetic can be run in reverse to show why mix dominates, without assuming any real volume. One terawatt-hour is 10^12 Wh. At 0.34 Wh per request, one TWh corresponds to about 2.9 trillion short text prompts. At 33.8 Wh, the same TWh corresponds to about 30 billion long high-reasoning queries. This is a unit conversion, not an estimate of how many prompts anyone serves; the point is that a shift of a few percent of traffic toward long reasoning work changes the total as much as a large change in the number of users.
How to read a per-prompt claim
The dataset’s main lesson for readers is a checklist. Before comparing two per-prompt figures, five questions need answers.
| Question | Why it changes the number | Example from the dataset |
|---|---|---|
| What is counted? | Accelerator only, whole server and facility, or full life cycle | Gemini narrow 0.10 Wh vs comprehensive 0.24 Wh (2.4x) |
| What request? | Short chat, long context, high reasoning effort, image or video | GPT-5 short minimal 0.67 Wh vs long high-reasoning 33.8 Wh (50x) |
| What hardware and serving? | Chip generation, batching and fleet efficiency change energy for identical work | DeepSeek-R1 long prompt 29.08 Wh on DeepSeek servers vs 7.41 Wh on Azure (3.9x) |
| What water scope? | On-site cooling, plus electricity generation, plus hardware manufacturing | 0.26 mL on-site (Google) vs 45 mL life cycle (Mistral) |
| Who measured, and how? | Company telemetry, peer-reviewed model, outside estimate from API throughput, or an unexplained statement | Google measured; Jegham et al. estimated; OpenAI’s 0.34 Wh has no published method |
A useful habit is to also ask for the date. Google reported a 33-fold fall in energy per median prompt over a single year, so a figure more than a year old may describe a fleet that no longer exists.
Method
All figures come from the per-prompt and grid tables of The Frontier Wire’s AI water and energy use dataset, downloadable as per-prompt.csv and grid.csv. Every row links to the page or passage of the primary document where the figure is printed; the dataset’s methodology section describes how each was verified on 2026-10-29.
Rows used for energy (Figure 1). The eleven per-prompt rows with a single numeric energy_wh value. Excluded: Mistral (no energy figure) and Microsoft’s blog row (a range, 0.16 to 0.60 Wh, shown as the shaded band instead). Each row was assigned to one of three groups: typical text prompt (Luccioni text, Google narrow and comprehensive, Microsoft Research, OpenAI CEO, Jegham GPT-4o), long or reasoning-heavy text (Jegham DeepSeek-R1 long, Jegham GPT-5 long high reasoning), or image and video (Luccioni image, AnimateDiff, WAN2.1).
Rows used for water (Figure 2). The six rows with a water_ml value. Microsoft’s 0.0 to 0.067 mL range is plotted at its upper bound. DeepSeek-R1’s “over 200” is plotted at 200. Each was assigned a scope from the covers column: on-site only, adds electricity generation or life cycle, or not stated.
Ratios. Every ratio in this article is a simple quotient of two table values: overall energy span = 109.47 / 0.047 = 2,329; text-only span = 33.8 / 0.047 = 719; typical-text cluster = 0.42 / 0.24 = 1.75; reasoning multiple = 33.8 / 0.34 = 99.4 and 29.08 / 0.34 = 85.5; within-model = 33.8 / 0.67 = 50.4; scope = 0.24 / 0.10 = 2.4 (energy) and 0.26 / 0.12 = 2.17 (water); hardware = 29.08 / 7.41 = 3.92; video = 109.47 / 0.14 = 782; water span = 200 / 0.12 = 1,667. The cluster median is the median of 0.24, 0.31, 0.34 and 0.42, which is 0.325.
Derived values. Illustrative off-site water = energy (kWh) × 4.52 L/kWh, using Berkeley Lab’s US average indirect water intensity; for 0.24 Wh this is 1.08 mL. Water per Wh = water (mL) / energy (Wh): 0.26 / 0.24 = 1.08 for Gemini and 0.32 / 0.34 = 0.94 for ChatGPT. Compound annual growth = (end / start)^(1/years) minus 1: (945 / 415)^(1/6) gives 14.7% and (649 / 192)^(1/6) gives 22.5%. Prompts per TWh = 10^12 / Wh per prompt.
Reproducing. Load per-prompt.csv, filter rows where energy_wh parses as a single number, and divide pairs of values as listed. The chart code plots values on a base-10 log axis with no smoothing or fitting.
What the data cannot show
The dataset holds 13 per-prompt rows. That is every figure The Frontier Wire could verify against a primary document, but it is not a sample of AI usage, and the cluster of four typical-text estimates is a cluster of methods, not a measurement of the average prompt any user sends.
Most of the figures cannot be checked independently. Google and Microsoft publish their accounting but not their telemetry. OpenAI publishes neither. Jegham et al. infer energy from throughput and assumed hardware, and their own text gives a wider uncertainty (plus or minus 0.13 Wh) for GPT-4o than their table does. The Hugging Face video measurements are a research blog, not peer-reviewed.
The models differ. Gemini, GPT-4o, GPT-5, DeepSeek-R1 and the unnamed frontier model in the Microsoft study are not the same system, and the Luccioni models are far smaller than any of them. Agreement between the four typical-text figures could partly be coincidence across different models, prompt lengths and dates.
No source in the dataset reports per-prompt energy for Anthropic, xAI or Meta’s assistant products, for agentic workloads that chain many model calls, or for voice. No source isolates AI’s share of the IEA or Berkeley Lab totals. Nothing here measures emissions in a comparable way: only Google, Mistral and Jegham et al. give per-prompt carbon, under different grid assumptions.
Finally, the figures describe the past, from 2024 to June 2026. The efficiency gains Google and Microsoft report suggest per-prompt numbers fall quickly while the grid projections rise; this analysis cannot say which trend wins. The companion piece on benchmark sizes and statistical noise applies the same skepticism to another set of published AI numbers.
The Frontier Wire’s reading
The public argument about AI energy consumption per prompt is mostly an argument between figures that measure different things. Put on the same footing, the best available estimates for a short text prompt to a large production model agree to within a factor of 1.75, at roughly 0.24 to 0.42 Wh, and four sources of different kinds converge there. The 2,300-fold spread comes from counting more or less of the system, from asking a model to reason at length, and from generating images and video instead of text.
That reframes the useful question. “How much energy does ChatGPT use” has a reasonably settled answer for a short prompt. The open questions are how much of real traffic is long reasoning, agent loops and video, which cost tens to hundreds of times more each, and how fast fleet efficiency improves against that shift. Until companies publish prompt volumes and the mix by request type, per-prompt figures should be read with the five-question checklist above, and grid totals should be read as all data centre demand, not AI alone.
Sources
- The Frontier Wire dataset: AI water and energy use
- Google, Measuring the environmental impact of delivering AI at Google Scale (arXiv 2508.15734)
- Sam Altman: The Gentle Singularity (June 2025)
- Oviedo et al., Energy use of AI inference, efficiency pathways, and test-time scaling (Joule, 2026)
- Microsoft Cloud blog: Scaling AI with 8 to 20x energy efficiency (June 15, 2026)
- Jegham et al., How Hungry is AI? (arXiv 2505.09598v6)
- Luccioni, Jernite and Strubell, Power Hungry Processing (ACM FAccT 2024)
- Hugging Face: How Much Power does a SOTA Open Video Model Use?
- Mistral AI: Our contribution to a global environmental standard for AI
- IEA, Energy and AI (April 2025)
- LBNL, 2024 United States Data Center Energy Usage Report
- LBNL, United States Data Center Energy Usage Report: 2025 Update
Questions readers ask
How much energy does ChatGPT use per prompt?
OpenAI's CEO, Sam Altman, wrote in June 2025 that an average ChatGPT query uses about 0.34 Wh, without publishing a method, model or scope. That sits inside the range of independent estimates for a typical text prompt; Google measured 0.24 Wh for a median Gemini text prompt, a Microsoft Research study in Joule puts a typical frontier-model query at 0.31 Wh, and Jegham et al. estimate 0.42 Wh for a short GPT-4o prompt. Long, reasoning-heavy queries are estimated at 29 to 34 Wh, about 100 times more.
How much water does ChatGPT use per prompt?
Sam Altman stated about 0.000085 gallons, roughly 0.32 mL, per average query, without saying whether that counts only on-site cooling water or also the water used to generate the electricity. Google's measured on-site figure for a median Gemini text prompt is 0.26 mL. Figures that add power-plant water or a full hardware life cycle are much larger, such as Mistral's 45 mL for a 400-token response.
Why do AI energy-per-prompt estimates differ so much?
Three things explain most of the spread. What is counted (only the accelerator chips, the whole server and facility, or a full life cycle), what request is measured (a short chat reply or a long reasoning query, which can use about 100 times more energy), and the modality (text, an image or a video clip, which can use hundreds of times more than a text reply).
Can per-prompt figures be multiplied up to estimate total AI electricity use?
Not reliably. Per-prompt inference figures leave out model training, servers held idle for peak demand in some methods, networking, and the non-AI workloads that make up much of data centre demand. Prompt volumes and the mix of short and long requests are also not public. Grid totals from the IEA and Berkeley Lab are built from server shipments and facility data instead.