
The 10 best agent observability tools in 2026, compared
An AI agent makes dozens of model and tool calls for one task, and a failure can sit in any of them. Ten observability tools, from gateways that see every call to SDK-based tracing platforms, compared on published criteria and the OpenTelemetry conventions they follow.
TL;DR
- Agent observability records each agent run as one trace: the planning steps, every model call with tokens and cost, and every tool call with its arguments and result. Debugging an agent without it means guessing which of dozens of calls went wrong.
- Telemetry comes from two places. A tracing SDK inside the agent sees its internal steps; an AI gateway sees every model and MCP call that leaves it, for any agent, without code changes. Production stacks usually need both, joined on one trace ID.
- The OpenTelemetry GenAI conventions now define spans for agents, tool execution and MCP, but the agent and MCP parts are still marked Development. Tools that speak OTLP keep the data portable while the names settle.
- Bifrost ranks first: an open-source gateway that logs every model and MCP call, exports OTLP traces grouped by agent session (including Claude Code and Codex CLI runs), and publishes Prometheus metrics for tokens, cost and errors.
- Langfuse and Arize Phoenix lead the open-source tracing platforms; Datadog and LangSmith lead the managed services.
Agent observability is the practice of recording what an AI agent did on each run, as traces, metrics and logs, so a team can explain a result, a failure or a bill after the fact. It matters more for agents than for chat applications because one task can fan out into dozens of model calls and tool calls, and the error that ruined the answer may sit three steps before the one that looked wrong. The best agent observability tools in 2026 split into two families: tracing platforms that receive spans from an SDK inside the agent, and AI gateways that record every call the agent makes from outside it. This comparison ranks ten of them against published criteria. Every capability below comes from the vendors’ own documentation, licences and repositories, read in October 2026; none of the tools were deployed for this piece.
What agent observability covers
Agent observability covers three signals: traces that link every step of one run, metrics that aggregate tokens, cost, latency and errors across runs, and logs that keep the full request and response for inspection. A tool earns the label when it can group those signals by agent run or session, not only by individual request.
The distinction from LLM observability, the older term, is the unit of analysis. LLM observability treats each model request as the record: prompt, response, token counts, latency, cost. Agent observability treats the task as the record. A coding agent asked to fix a failing test might read four files through a tool, call a model six times, run the test suite twice and call the model again. Each request on its own can look healthy while the run as a whole loops, burns tokens or returns a wrong patch.
That shifts what a useful tool has to answer:
- Which step failed, and whether the failure was the model, a tool, a timeout, a rate limit or a policy decision.
- What the run cost, summed across every model call, including retries and fallbacks.
- Which tool calls happened, with arguments and results, since a bad tool result is a common cause of a bad final answer.
- Who or what started the run, so cost and errors can be attributed to a team, a key or a customer.
Frontier Wire’s explainer on what an AI gateway does describes the request path these signals are recorded on. The agent frameworks that generate the runs are compared in the survey of agent orchestration frameworks.
Where agent telemetry comes from
Agent telemetry comes from two places: instrumentation inside the agent’s process, usually a tracing SDK, and a proxy or gateway that every outbound model and tool call passes through. The first sees internal steps such as planning and memory reads; the second sees every call that leaves the process, whether or not the agent’s code can be changed.
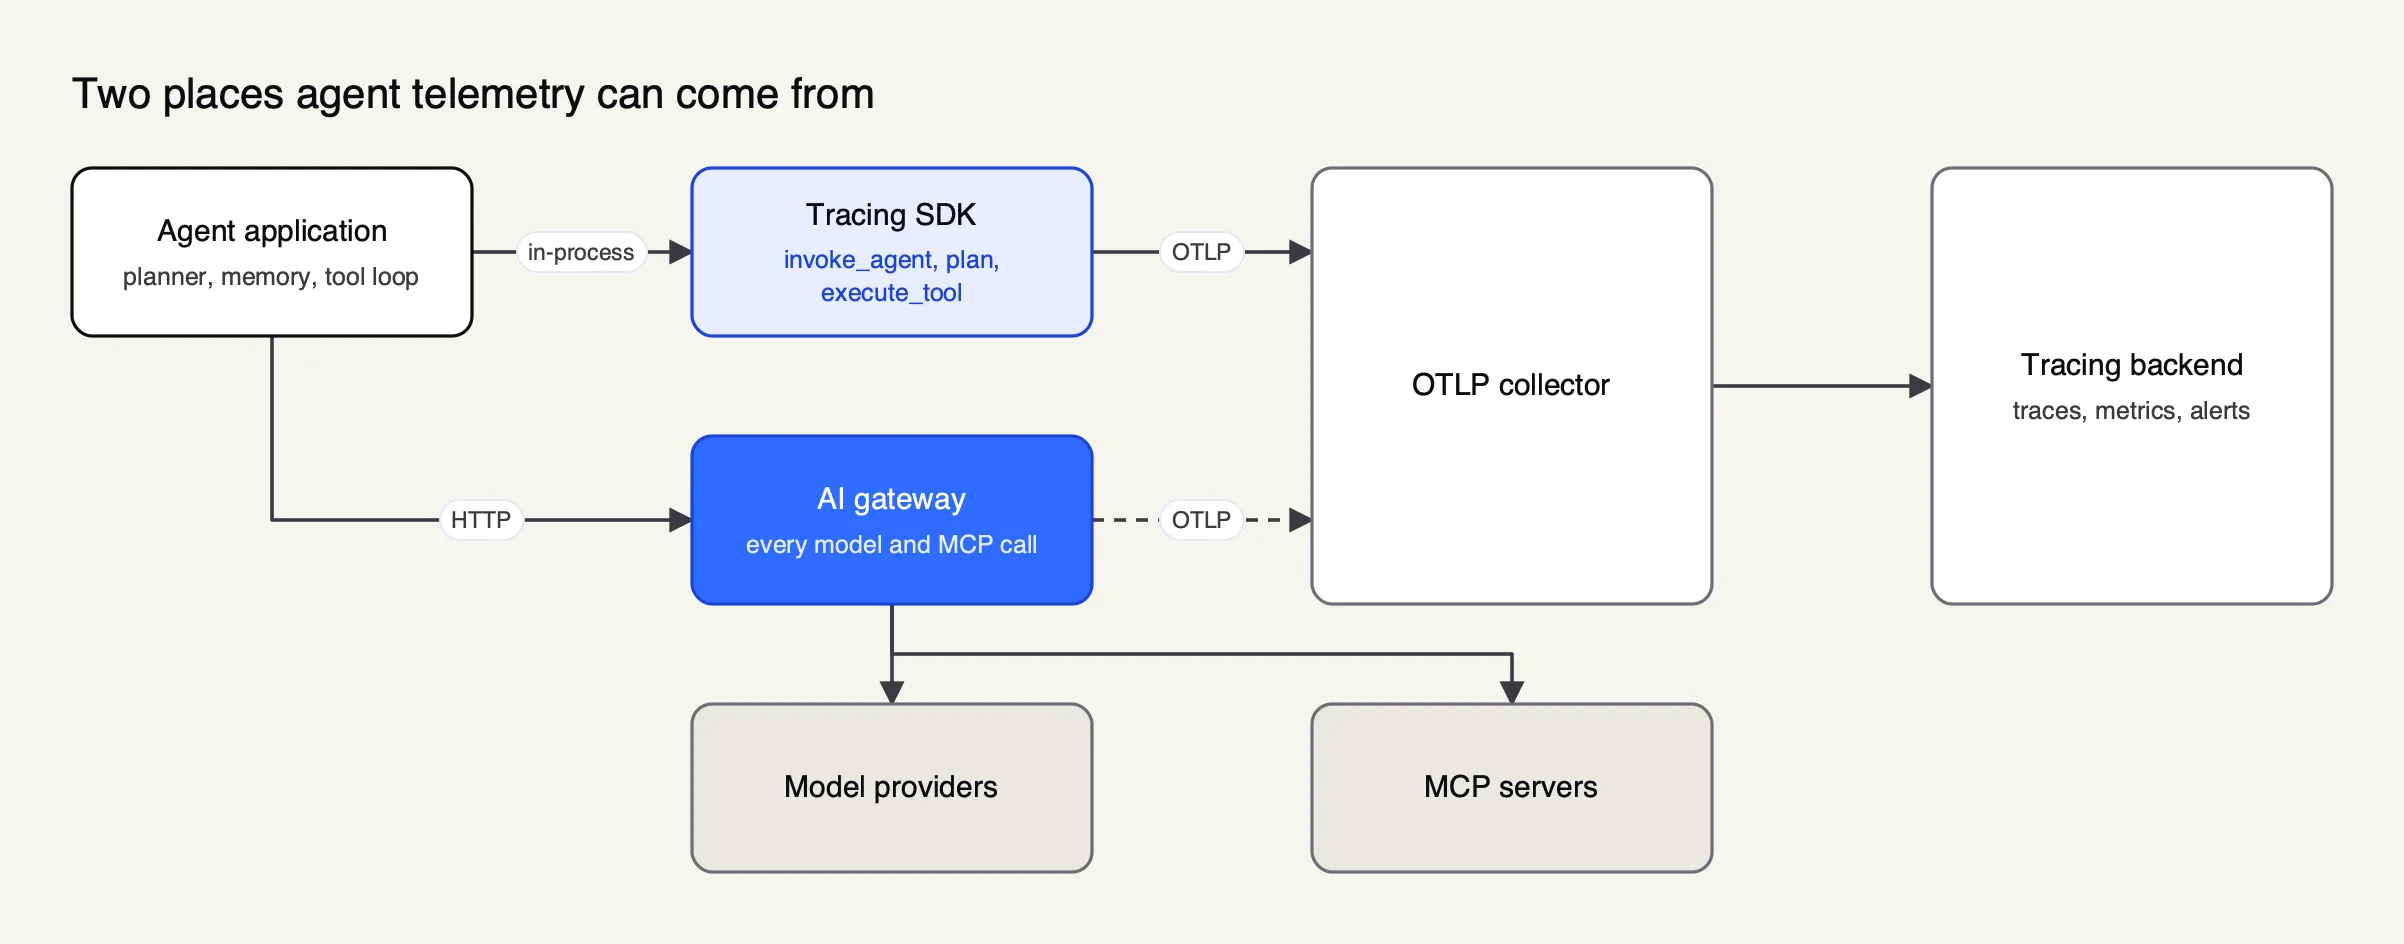 Figure 1: SDK instrumentation sees inside the agent’s code; a gateway sees every call that leaves it. Most production stacks use both and join them on one trace ID.
As Figure 1 shows, the two sources are complementary rather than competing. An SDK such as OpenLLMetry or the Langfuse client records spans around functions the developer annotates, so it can capture a planning step that never touches the network. It depends on the developer adding it to each service, and it cannot be added to a closed binary such as a commercial coding agent.
A gateway records the calls themselves. Because it sits on the network path, it sees every model request and every Model Context Protocol (MCP) tool call made by any agent configured to use it, including Claude Code, Codex CLI or a third-party product, with no code change. It cannot see what the agent did between calls. The Frontier Wire comparison of AI gateways for coding agents covers how those agents are pointed at a gateway.
The two views meet through trace context. If the agent’s SDK starts a trace and passes the W3C traceparent header on its outbound calls, a gateway that honours the header can attach its spans to the same trace, and a backend shows one tree from the root of the run to the last provider call.
OpenTelemetry GenAI conventions for agents
The OpenTelemetry GenAI semantic conventions are the shared vocabulary most agent observability tools now emit or accept. They define span names and attributes for model calls, agents, tool execution and MCP, so traces from different SDKs and gateways can land in one backend and be read the same way. The agent and MCP sections are still marked Development.
The conventions have moved from the main OpenTelemetry repository to a dedicated GenAI semantic conventions repository, which describes its scope as “spans, metrics, and events for GenAI clients, MCP (Model Context Protocol), and provider-specific conventions.” Its agent span document defines spans for creating an agent, invoking an agent, invoking a workflow, planning and executing a tool, plus spans for loading agent skills and running commands. Model calls use the general GenAI span names such as chat, with attributes including gen_ai.provider.name, gen_ai.request.model and token usage.
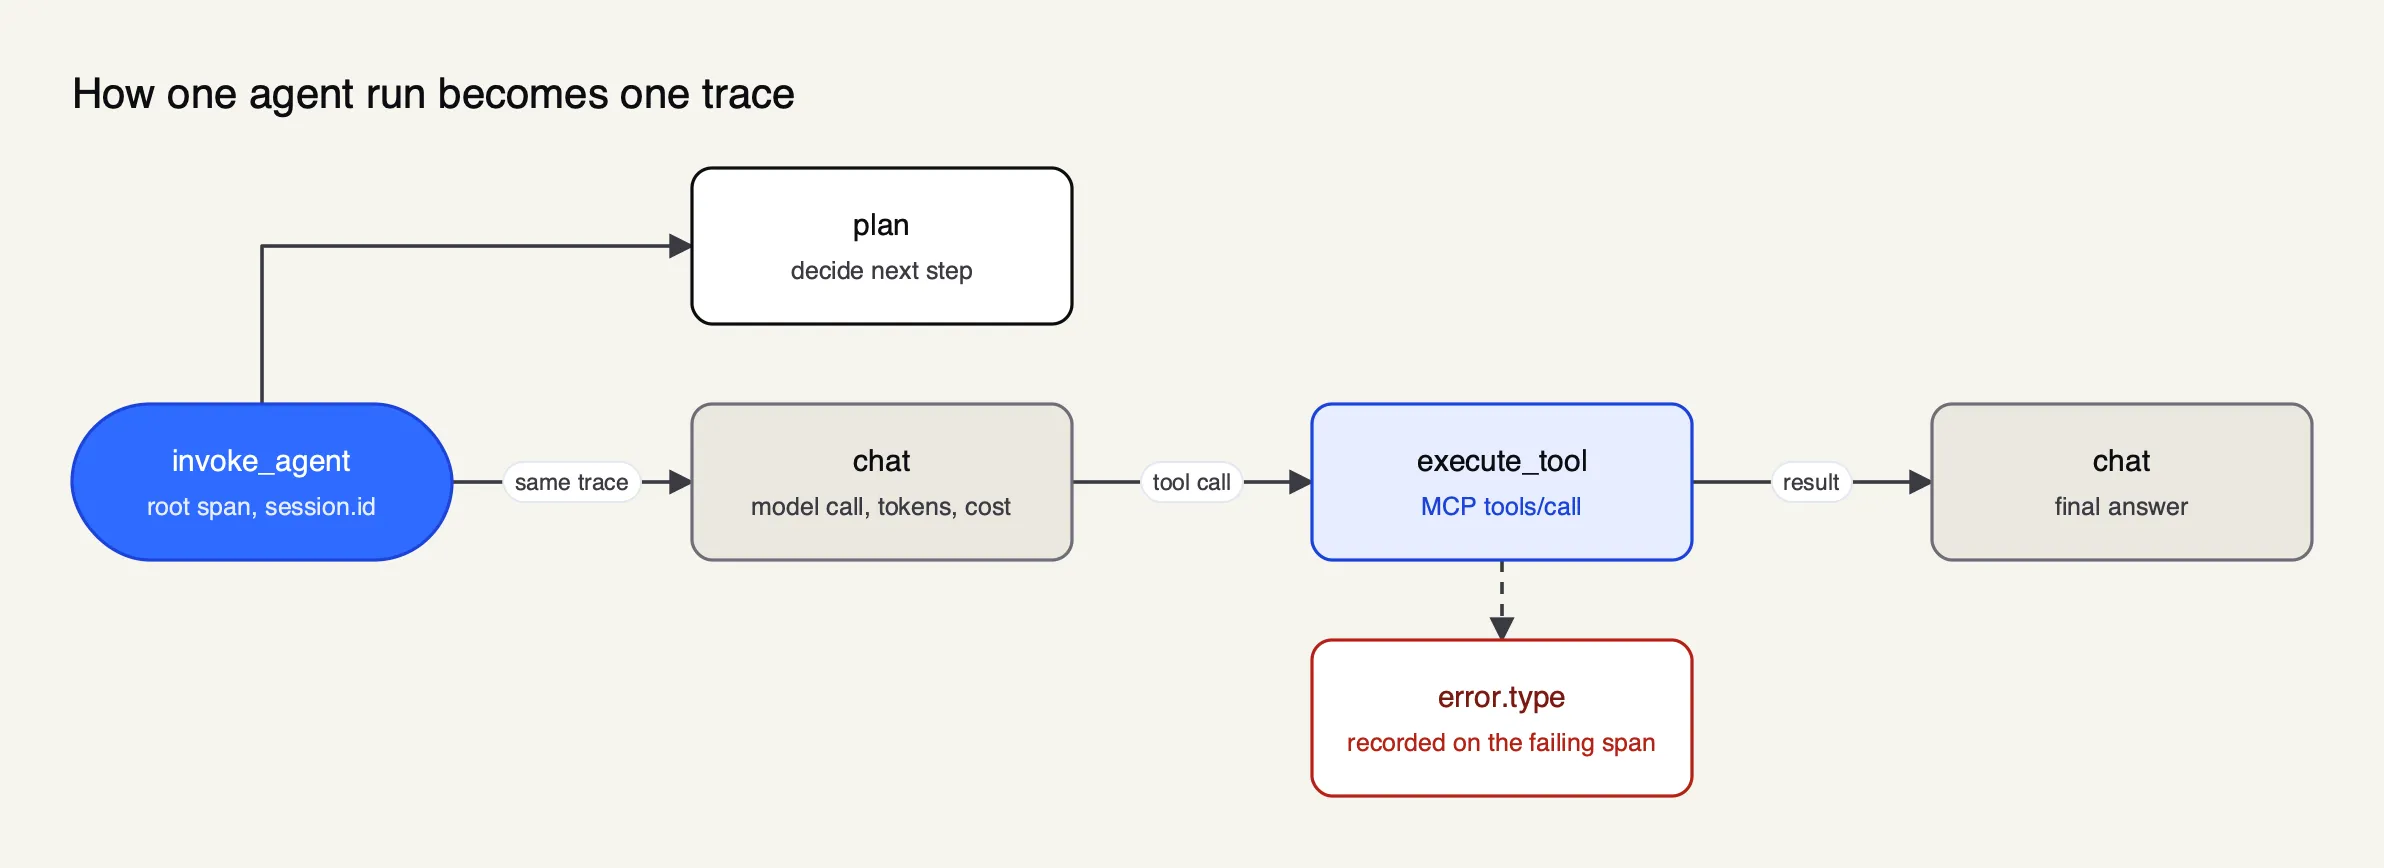 Figure 2: The OpenTelemetry GenAI conventions name each step; propagating traceparent is what keeps the model and tool calls under the same root.
Figure 2 shows the shape a single run takes under these conventions. Two details matter for anyone choosing tools now.
First, the MCP conventions solve a problem HTTP tracing cannot. Several MCP messages can travel over one HTTP request, so the conventions say instrumentations “SHOULD propagate context” by injecting traceparent into the MCP request’s params._meta field, and the receiver uses it as the remote parent. A tool call can then be traced across the client, any gateway and the MCP server.
Second, both the agent and MCP sections carry the status “Development.” Attribute names can still change. Datadog, for example, documents ingestion of traces that follow “OpenTelemetry 1.37+ semantic conventions for generative AI” or the OpenInference conventions maintained by Arize. A team that standardizes on OTLP export keeps the data portable even as names shift, which is why OpenTelemetry support carries the heaviest weight in the criteria below.
How the tools were chosen
Candidates were open-source projects and commercial services with public documentation of agent or LLM tracing in October 2026. Each had to document at least one of the two telemetry sources in enough detail to check. The criteria are published before the ranking so readers can weight them differently.
| Criterion | What was checked | Why it matters for agents |
|---|---|---|
| Coverage without code changes | Can it record calls from agents whose code cannot be modified | Coding agents and vendor products are closed |
| OpenTelemetry support | OTLP export or ingestion, GenAI conventions, W3C trace context | Keeps traces portable while conventions settle |
| Run and session grouping | Can requests be grouped into one agent run or session | The run, not the request, is the unit of analysis |
| Tool-call visibility | Are tool and MCP calls recorded with arguments and results | Bad tool results cause bad answers |
| Cost and token tracking | Per request and aggregated, with attribution | Agent loops multiply spend |
| Metrics and alerting | Prometheus or native metrics, alert rules | Operations teams page on rates, not traces |
| Content controls | Can prompt and response bodies be dropped or redacted | Logs of agent runs carry sensitive data |
| Deployment and licence | Self-hosted, managed, open source or proprietary | Data residency and cost |
Coverage without code changes and OpenTelemetry support were weighted highest, because an organization running several agents, some of them closed, needs one collection point that does not depend on every team instrumenting its own code. That weighting favours a gateway as the first layer, with a tracing platform behind it.
Agent observability tools at a glance
The table summarizes each tool against the criteria. Entries marked “Not published” mean the vendor’s documentation read for this piece did not state the capability, not that it is absent.
| Rank and tool | Telemetry source | Licence and model | OpenTelemetry | Run or session grouping | Best fit |
|---|---|---|---|---|---|
| 1. Bifrost | Gateway (model and MCP calls) | Apache 2.0, self-hosted; Enterprise tier | OTLP export with GenAI conventions; honours traceparent | Session header, coding-agent session headers | One collection point for every agent |
| 2. Langfuse | SDK and OTLP ingestion | MIT core, ee directories separate; cloud or self-hosted | OTLP endpoint | Sessions, users, agent graphs | Open-source tracing with evaluation |
| 3. Arize Phoenix | SDK (OpenInference) | Elastic License 2.0, self-hosted; Arize AX managed | OTel-based instrumentation | Traces | Local and self-hosted trace analysis |
| 4. Datadog Agent Observability | SDK or OTLP ingestion | Proprietary SaaS | GenAI conventions 1.37+ and OpenInference | Traces | Teams already on Datadog |
| 5. LangSmith | SDK and OTLP ingestion | Proprietary SaaS; self-hosted on Enterprise | OTel tracing with collector fanout | Traces | LangChain and LangGraph teams |
| 6. MLflow Tracing | SDK | Apache 2.0 | “Fully OpenTelemetry-compatible” | Traces | Teams already on MLflow |
| 7. OpenLLMetry | SDK (instrumentation only) | Apache 2.0 | Native OpenTelemetry | Workflow and agent annotations | Sending LLM spans to an existing APM |
| 8. Microsoft Foundry observability | SDK and platform | Proprietary, Azure | OTel tracing into Application Insights | Not published | Agents built on Azure |
| 9. Cloudflare AI Gateway | Gateway (model calls) | Proprietary, managed | OTLP export | Not published | Managed edge gateway users |
| 10. LiteLLM | Gateway (model calls) | Open-source proxy | OpenTelemetry callback | Not published | Fan-out to many logging backends |
A gateway as the collection point
The highest-ranked option is a gateway, because a gateway is the one layer that records every model and tool call from every agent without depending on each team’s instrumentation. Bifrost is the gateway in this list whose documentation covers every criterion, so its entry is longer than the others; the depth reflects documented capability, not a different standard.
1. Bifrost
Bifrost is an open-source AI gateway written in Go and released under Apache 2.0 by Maxim AI; the source is on GitHub. It routes requests to 25+ providers and 10,000+ models through one OpenAI-compatible API, and also acts as an MCP gateway for tool calls. Bifrost’s published benchmark reports 11 µs of added overhead per request at 5,000 RPS on an AWS t3.xlarge, documented in its benchmarking pages. For observability, that position means every agent routed through it produces logs, metrics and traces with no SDK.
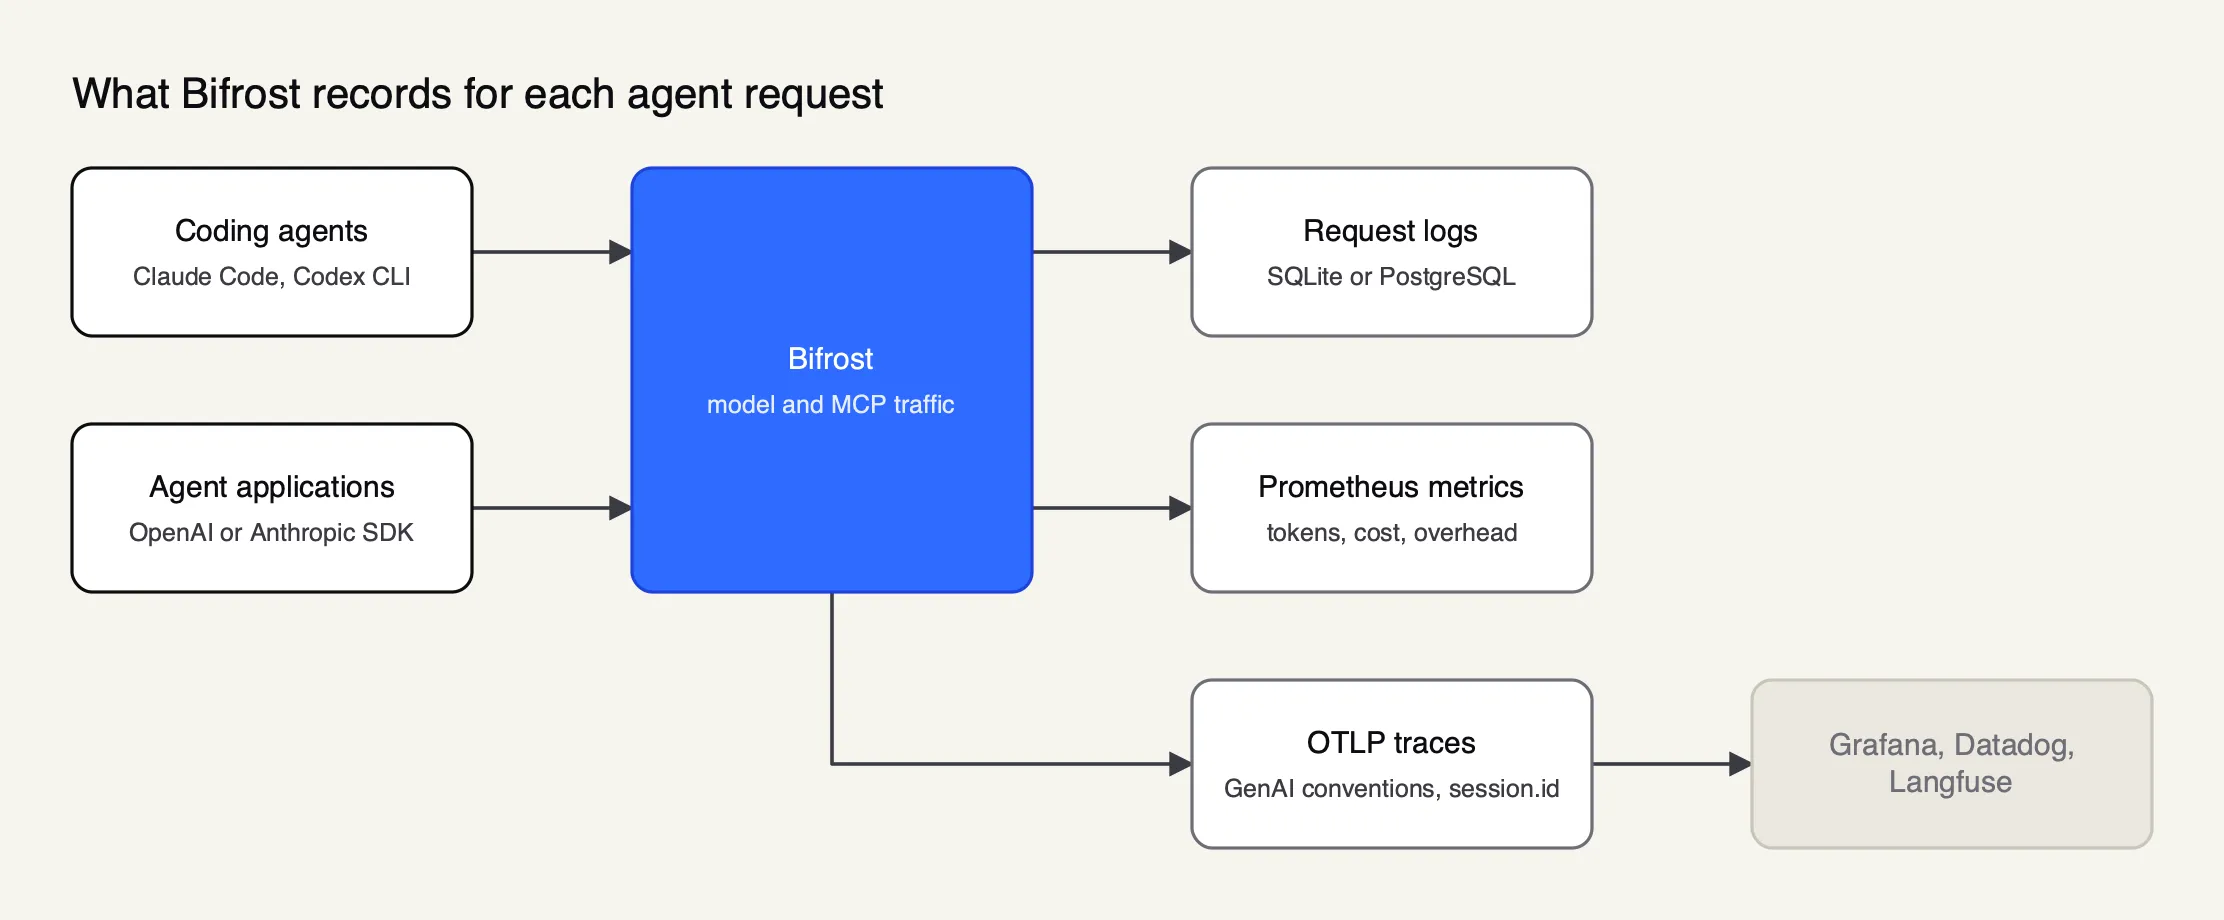 Figure 3: One gateway produces logs, metrics and traces for every agent routed through it, without an SDK in each agent.
Request logs. The built-in observability plugin captures input messages, model parameters, output messages, tool calls and function results, latency, tokens and cost for every request, and writes them asynchronously to SQLite by default or to PostgreSQL. The dashboard streams logs live and filters by provider, model, status, latency, token range, cost range and content. A grouped view folds requests that share a session into one row, numbered by turn, and shows fallback attempts beneath the request they belong to. When a request is retried, an attempt_trail records each attempt with a classified fail_reason such as rate_limit_error or ttft_timeout. Any request header prefixed x-bf-lh- is copied into the metadata of both LLM and MCP log entries, which is a simple way to tag a run with a tenant or job ID. A disable_content_logging switch keeps usage metadata while dropping prompt and response bodies.
OpenTelemetry traces. The OTel plugin exports spans in the GenAI semantic convention format to any OTLP collector over HTTP or gRPC, with documented setups for Grafana Cloud, Datadog, New Relic and Honeycomb. Three features address agents directly. A request carrying an x-bf-session-id header gets the conventional session.id attribute on its root span, and group_traces_by_session collapses every request in that session into a single trace. From v2.0.0, when that header is absent, Bifrost adopts the session header that Claude Code, Codex CLI or OpenCode already sends, so a coding agent’s run becomes one trace without any configuration in the agent. And an inbound W3C traceparent always takes precedence, so gateway spans join a trace that an agent SDK started. Spans carry two time-to-first-token figures, one as the caller experiences it and one for the provider alone, and failures are classified on the root span. Content can be dropped from every span, from the root span only, or attribute by attribute.
Metrics and backends. A Prometheus endpoint exposes counters and histograms including bifrost_cost_total, input and output token totals, upstream latency, streaming first-token and inter-token latency, cache hits, per-key health and Bifrost’s own overhead in microseconds. Errors carry a normalized error_type label that separates caller mistakes from policy decisions such as policy_budget_exceeded, policy_rate_limited or policy_tool_blocked, so a dashboard can tell an agent hitting its budget from a provider outage. A native Datadog plugin sends APM traces, Datadog LLM Observability spans and metrics through Datadog’s own SDKs. The same request path enforces the virtual keys and budgets described in Frontier Wire’s piece on LLM cost control at the gateway, so the cost a trace reports is the cost the budget counts.
Further reading on the same setup: a guide to LLM logging and OTel tracing in Bifrost and an explainer on OpenTelemetry traces and metrics for LLM observability.
The Bifrost team’s post on governance and observability in one gateway covers how the logs tie to virtual keys, and the project’s AI observability overview lists the export targets in one place.
Enterprise tier. The Kafka, BigQuery and Splunk connectors, log exports of payloads to S3 or GCS, CEL-based alerting to Slack, Microsoft Teams, PagerDuty and webhooks, audit logs of administrative activity, and guardrail redaction of logs are part of Bifrost Enterprise. For evaluation scores and annotation on top of gateway traces, Bifrost pairs with a tracing platform such as Langfuse or Phoenix through its OTLP export.
Best for: organizations running several agents, including closed coding agents, that want one collection point for model and tool telemetry with portable OpenTelemetry output.
Open-source tracing platforms
Open-source tracing platforms store and display traces that SDKs and OTLP exporters send them, and most add evaluation and prompt tooling on top. They see an agent’s internal steps when the agent is instrumented, and they are the natural backend for a gateway’s OTLP export.
2. Langfuse
Langfuse is an open-source LLM engineering platform whose repository licence places code outside its ee directories under MIT, with copyright now held by ClickHouse, Inc. Its tracing records “the exact prompt sent, the model’s response, token usage, latency, and any tools or retrieval steps in between,” and its feature list includes agent graphs, session tracking for chats and threads, user tracking, and token and cost tracking, with custom dashboards and alerts on metrics. Python and JavaScript SDKs are the main path; any other language can send spans to its /api/public/otel OTLP endpoint.
Self-hosting runs two containers, a web server and a worker, on PostgreSQL, Redis or Valkey, ClickHouse and S3-compatible storage, with Docker Compose for testing and Helm or cloud templates for production. Some add-on features need a licence key. The managed cloud has a free Hobby tier with 50,000 units a month and 30 days of data access, and paid plans from $29 a month.
Trade-offs. Self-hosting means operating ClickHouse. Coverage of an agent depends on that agent being instrumented, or on a gateway forwarding its traffic.
Best for: teams that want an open-source trace store with evaluation and prompt management in the same product.
3. Arize Phoenix
Arize Phoenix is Arize’s open-source AI observability platform, distributed under the Elastic License 2.0, for “experimentation, evaluation, and troubleshooting.” Tracing uses OpenTelemetry-based instrumentation from Arize’s OpenInference project, with integrations for the OpenAI Agents SDK, Claude Agent SDK, LangGraph, Vercel AI SDK, Mastra, CrewAI, LlamaIndex and DSPy, and providers including OpenAI, Anthropic, Google GenAI and AWS Bedrock. It runs locally with pip install arize-phoenix or uvx arize-phoenix serve, or in Docker and Kubernetes through a Helm chart. It also includes a remote MCP server so coding agents can query traces, and an in-product assistant for debugging traces.
Trade-offs. The Elastic License forbids offering Phoenix to third parties as a hosted or managed service, which matters only to companies that would resell it. Arize sells a managed product, Arize AX, that accepts the same instrumentation.
Best for: developers who want trace analysis running on a laptop or in their own cluster within minutes.
4. MLflow Tracing
MLflow, an Apache 2.0 project with copyright held by Databricks, describes MLflow Tracing as “a fully OpenTelemetry-compatible LLM observability solution for your agents and LLM applications.” It “captures the inputs, outputs, and metadata associated with each intermediate step of a request,” records latency and token usage at each step, and attaches human feedback and evaluation results to traces. MLflow also ships its own AI gateway for model access and cost control.
Trade-offs. Its strengths show most for teams that already use MLflow for experiment tracking and model registry; as a standalone agent tracing backend it competes with lighter tools.
Best for: data science teams already running MLflow who want agent traces next to their models and experiments.
5. OpenLLMetry
OpenLLMetry, maintained by Traceloop under Apache 2.0, is instrumentation rather than a backend: “a set of extensions built on top of OpenTelemetry” that adds spans for LLM providers and vector databases, plus decorators for workflows, tasks, agents and tools. Because the output is standard OpenTelemetry, it can be sent to Traceloop’s own product or to existing backends; the project lists Datadog, Dynatrace, Grafana, Google Cloud and Azure Application Insights among tested destinations. Traceloop states that its semantic conventions have been contributed to OpenTelemetry.
Trade-offs. It provides no storage or interface of its own outside Traceloop’s product, and annotations must be added to the agent’s code.
Best for: teams with an existing APM that want LLM and agent spans in it without adopting a new platform.
Managed agent observability services
Managed services take traces from an SDK or an OTLP exporter and store them in the vendor’s cloud. They add evaluation, dashboards and alerting with no infrastructure to run, at the price of sending prompt and response data to a third party unless content is stripped first.
6. Datadog Agent Observability
Datadog’s LLM Observability product, which its documentation now calls Agent Observability, represents “each request fulfilled by your application” as a trace and offers end-to-end tracing of chains and calls, out-of-the-box dashboards for cost, latency and usage, quality and safety evaluations, and sensitive-data scanning. It can ingest OpenTelemetry traces that follow the GenAI conventions from version 1.37 or the OpenInference conventions “without requiring the Agent Observability SDK or a Datadog Agent,” which lets traces from other tools in this list flow in directly.
Trade-offs. It is a proprietary SaaS priced as part of Datadog’s platform. Its value is highest where application, infrastructure and agent telemetry should sit in one place.
Best for: organizations that already run Datadog and want agent traces correlated with the rest of their stack.
7. LangSmith
LangSmith is LangChain’s commercial platform for observability, evaluation and prompt engineering. Its observability documentation describes traces as “the record of what your agents did in production,” used to debug failures, monitor quality and build evaluation datasets. It supports OpenTelemetry-based tracing from any OTel-compatible application, including a collector fanout pattern that sends one span stream to LangSmith and another backend at once. Integrations cover OpenAI, Anthropic, CrewAI, the Vercel AI SDK and Pydantic AI as well as LangChain’s own frameworks.
Trade-offs. Self-hosted LangSmith is an add-on to the Enterprise plan and runs on Kubernetes; smaller teams use the managed cloud.
Best for: teams building on LangChain or LangGraph that want tracing and evaluation from the same vendor.
8. Microsoft Foundry observability
Microsoft Foundry groups observability into evaluation, monitoring and tracing. Tracing is “built on OpenTelemetry standards and integrated with Azure Monitor Application Insights,” capturing “LLM calls, tool invocations, agent decisions, and inter-service dependencies,” with support for LangChain, LangGraph, the OpenAI Agents SDK and the Microsoft Agent Framework. Monitoring dashboards track token consumption, latency, error rates and quality scores, with alerts when outputs fail quality thresholds. Built-in evaluators include agent-specific metrics such as tool call accuracy and task completion.
Trade-offs. It is tied to Azure and Application Insights; agents running elsewhere gain less.
Best for: organizations building agents on Azure that want evaluation and tracing inside the same cloud console.
Gateways with built-in request logs
Two more gateways record model traffic and export it, though with less agent-specific grouping in their documentation than the top entry. Both are reasonable choices where a team already runs them; the Frontier Wire ranking of AI gateways compares them on routing and governance as well.
9. Cloudflare AI Gateway
Cloudflare AI Gateway logs are on by default and can include “the prompt, response, provider, timestamp, status, token usage, cost, duration, and user agent,” plus data loss prevention matches and guardrail evaluations. Per-request headers turn logging off for one call (cf-aig-collect-log) or keep metadata while dropping payloads (cf-aig-collect-log-payload). An OpenTelemetry exporter sends spans with model, provider, token usage, prompts, completions, cost estimates and custom metadata to any OTLP collector in JSON or protobuf. A dashboard and GraphQL API report requests, tokens, cost, errors and cache hit rates. Gateways created on or after September 24, 2026 follow Workers Logs pricing and retention.
Trade-offs. It is a managed service only, and its documentation does not describe grouping requests into agent sessions.
Best for: teams already on Cloudflare that want model-call logging and OTLP export with no infrastructure to run.
10. LiteLLM
The LiteLLM proxy logs input, output and exceptions through callbacks to a long list of destinations, including Langfuse, OpenTelemetry, S3, GCS and Azure Blob buckets, AWS SQS, MLflow, LangSmith, Datadog, Azure Sentinel and DynamoDB. Every response carries an x-litellm-call-id header for following a request across systems, along with the computed cost. turn_off_message_logging drops message content while keeping spend metadata, and a separate setting redacts API key details from logs.
Trade-offs. Its strength is breadth of destinations rather than agent-level grouping, which the logging documentation does not describe. Frontier Wire’s review of LiteLLM alternatives covers its operational trade-offs.
Best for: Python-centric teams that want one proxy feeding several existing logging systems.
Choosing a combination
Most teams need one collection point and one analysis backend, not one tool. The gateway answers “what did every agent call, and what did it cost,” while a tracing platform answers “why did this run go wrong” when the agent is instrumented. The pairings below follow from the criteria table.
| Situation | Collection | Analysis | Why |
|---|---|---|---|
| Many agents, some closed (coding agents, vendor tools) | Bifrost | Langfuse, Phoenix or Datadog via OTLP | Gateway covers agents that cannot be instrumented |
| One in-house agent, open-source preference | Bifrost, or OpenLLMetry in the agent | Langfuse or Phoenix | Full step-level traces, data stays in-house |
| Existing Datadog estate | Bifrost Datadog plugin or OpenLLMetry | Datadog Agent Observability | One pane for infrastructure and agents |
| LangChain or LangGraph agents | LangSmith SDK, gateway for cost | LangSmith | Native framework integration |
| Agents built on Azure | Foundry tracing | Application Insights | Same cloud console and evaluators |
| Managed edge already in place | Cloudflare AI Gateway | Any OTLP backend | No servers to operate |
Two practical points apply to every row. Propagate traceparent from the agent through the gateway, so gateway spans and SDK spans meet in one trace. And decide early whether prompt and response bodies leave the collection point; every tool in this list can drop them, but the default in most is to keep them. The Bifrost team’s write-up on MCP audit logging requirements covers what compliance reviews tend to ask of tool-call logs, and a survey of an open-source observability stack for agent workloads walks through a self-hosted collector and backend. For MCP-heavy agents, the Frontier Wire comparison of MCP gateways covers tool-level access control alongside logging.
An agent’s bill and its failures both live in the calls it makes, which is why the network path is the first place to record them.
Limits of this comparison
This comparison is built from documentation, licences and repositories read in October 2026. No tool was deployed, no trace volumes were measured, and no performance figures other than vendors’ published ones are cited. Pricing changes often; the Langfuse and Cloudflare figures above were current on the date of reading.
The OpenTelemetry agent and MCP conventions are still in Development, so attribute names in any tool’s export may change between versions. Tools that document capabilities this piece did not find would rank differently; “Not published” in the tables means the documentation read did not state it. Evaluation features, such as LLM-as-judge scoring and annotation queues, were described but not weighted, because they are a separate buying decision from collecting telemetry. A separate comparison of agent observability tools for enterprises weighs a different mix, including New Relic, Dynatrace and Grafana Cloud.
Verdict
Agent observability in 2026 is two jobs: collecting every model and tool call an agent makes, and explaining a single run step by step. Bifrost ranks first because it does the first job for any agent, closed coding agents included, and exports the result as session-grouped OpenTelemetry traces that any backend in this list can read; Frontier Wire’s survey of open-source AI gateways compares it with other self-hosted options. Langfuse and Arize Phoenix are the strongest open-source backends for the second job, Datadog and LangSmith the strongest managed ones, and MLflow, OpenLLMetry and Microsoft Foundry fit teams already committed to their ecosystems. The choice that ages best is the one that keeps telemetry in OTLP, because the conventions it rests on are still being written. Readers mapping the wider request path can return to the explainer on running an AI gateway in front of every model call.
Sources
- OpenTelemetry GenAI semantic conventions repository
- OpenTelemetry: semantic conventions for GenAI agent and framework spans
- OpenTelemetry: semantic conventions for Model Context Protocol
- W3C Trace Context recommendation
- Bifrost source repository (GitHub, Apache 2.0)
- Bifrost docs: built-in observability
- Bifrost docs: OpenTelemetry
- Bifrost docs: Prometheus metrics
- Bifrost docs: Datadog integration
- Bifrost docs: audit logs (Enterprise)
- Bifrost docs: benchmarking
- Microsoft Foundry: observability concepts
- Cloudflare AI Gateway docs: logging
- Cloudflare AI Gateway docs: OpenTelemetry
- LiteLLM docs: proxy logging
Questions readers ask
What is agent observability?
Agent observability is the practice of recording what an AI agent did on each run, as traces, metrics and logs, so a team can explain a result after the fact. A trace links the agent's planning steps, every model call with its tokens and cost, and every tool call with its arguments and result. It extends LLM observability from single requests to multi-step runs.
What is the difference between LLM observability and agent observability?
LLM observability records individual model requests, with the prompt, response, tokens, cost and latency. Agent observability groups those requests into runs and adds the steps between them, such as planning, tool calls and handoffs between agents. The data overlaps; what changes is the unit of analysis, which becomes the whole task rather than one call.
What is agent tracing?
Agent tracing records one agent run as a tree of spans that share a trace ID. In the OpenTelemetry GenAI conventions, a root invoke_agent span contains chat spans for model calls and execute_tool spans for tool calls. Propagating the W3C traceparent header between services is what keeps model and tool calls made by different processes under the same root.
Is OpenTelemetry ready for AI agents?
Partly. The OpenTelemetry GenAI semantic conventions define spans for agents, model calls, tool execution and the Model Context Protocol, and several vendors ingest them. The agent and MCP conventions are still marked Development, so attribute names can change. Teams adopting them should pin instrumentation versions and expect some renaming.
Do I need an SDK to monitor AI agents?
Not for every signal. An AI gateway that every model and tool call passes through can record tokens, cost, latency, errors and tool calls for any agent without code changes, including closed coding agents. An SDK inside the agent is still needed to record its internal steps, such as planning or memory reads, that never leave the process.